RNA-seq
Methy
ncRNA
Version 1.2
released on March 16th, 2026
11
RNA-seq
5
Methy
18
ncRNA
37
Literature References
List abstract result
List abstract result
List abstract result
Differential Expression Analysis
Differential Expression Analysis - Help Guide
This help document provides guidance on how to use the Differential Expression Analysis tool effectively. Below are explanations of each section of the interface and how to configure parameters for analysis.
1. Dataset Select
Select the dataset to analyze from the dropdown menu. Each dataset is identified by a unique CPMOAD ID (e.g., R0001). Make sure to choose the dataset that matches your research focus.
2. DE Parameters
- Log2FC Cutoff: Specify the minimum log2 fold-change value for filtering results. A higher value will only display genes with significant changes in expression.
- p-adjust Cutoff: Set the threshold for adjusted p-values. Results with p-values below this cutoff are considered statistically significant.
3. Differential Methods
Choose the statistical method for differential expression analysis:
- DESeq2: A robust method for RNA-Seq data with small sample sizes.
- EdgeR: Suitable for datasets with biological replicates and over-dispersed counts.
4. Results Table
The results table shows the differentially expressed genes based on your input parameters. The table includes the following columns:
- entrezgene_id: Unique gene identifier.
- baseMean: Mean expression level across all samples.
- log2FoldChange: Log2-transformed fold change between conditions.
- lfcSE: Standard error of the log2 fold change.
- stat: Test statistic for differential expression.
- pvalue: Raw p-value for the statistical test.
- padj: Adjusted p-value (FDR).
5. Search and Navigation
Use the search bar to find specific genes by their ID or other attributes. Navigate between pages using the pagination controls at the bottom of the table.
6. Download Data
Click the Download Data button to export the results as a CSV file for further analysis.
Troubleshooting
- If no results appear, adjust the Log2FC or p-adjust Cutoff parameters to broaden the search.
- Ensure the correct dataset is selected before running the analysis.
For further assistance, contact the system administrator or refer to the official documentation.
Heatmap & Volcano
Heatmap & Volcano Plot - Help Guide
This guide explains how to use the Heatmap & Volcano Plot tool to visualize differential expression data. Below are detailed instructions for configuring parameters, generating plots, and interpreting the results.
1. Dataset Select
Select a dataset from the dropdown menu using its CPMOAD ID. Make sure the dataset you choose aligns with your analysis requirements.
2. DE Parameters
- Log2FC Cutoff: Define the minimum log2 fold-change value to filter genes. Increasing the value will display only genes with significant changes in expression.
- p-adjust Cutoff: Set the adjusted p-value threshold. Genes with p-values below this threshold will be included in the visualization.
3. Log2 Fold Change Direction
- Both: Display both upregulated and downregulated genes.
- Up: Show only upregulated genes.
- Down: Display only downregulated genes.
4. Differential Methods
Select the method used for differential expression analysis:
- DESeq2: Suitable for RNA-Seq data with small sample sizes.
- EdgeR: Ideal for datasets with biological replicates and over-dispersed data.
5. Top DE Genes Slider
Use the slider to specify the number of top differentially expressed genes to display in the plots. You can adjust the range from 10 to 100.
6. Plot Button
Click the Plot button to generate the Heatmap and Volcano Plot based on the selected parameters.
7. Heatmap
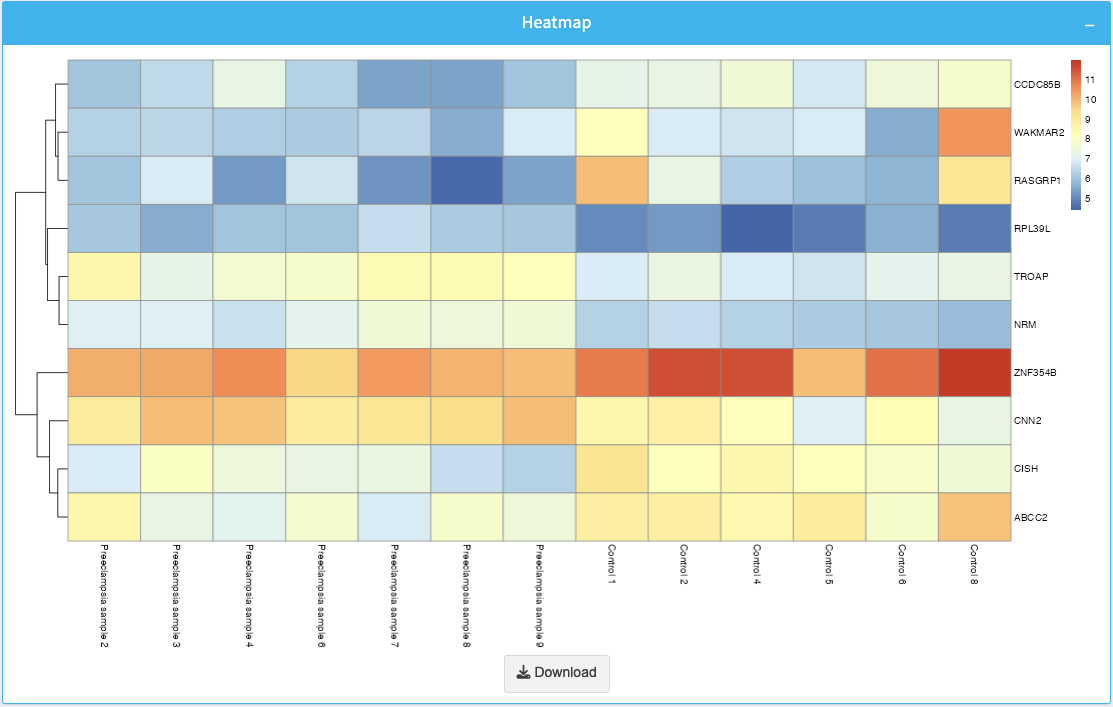
The Heatmap visualizes the expression levels of the top differentially expressed genes across different samples. Use this to identify patterns and clustering of genes or samples.
- Blue shades indicate low expression.
- Red shades represent high expression.
You can download the heatmap as an image using the Download button below the plot.
8. Volcano Plot
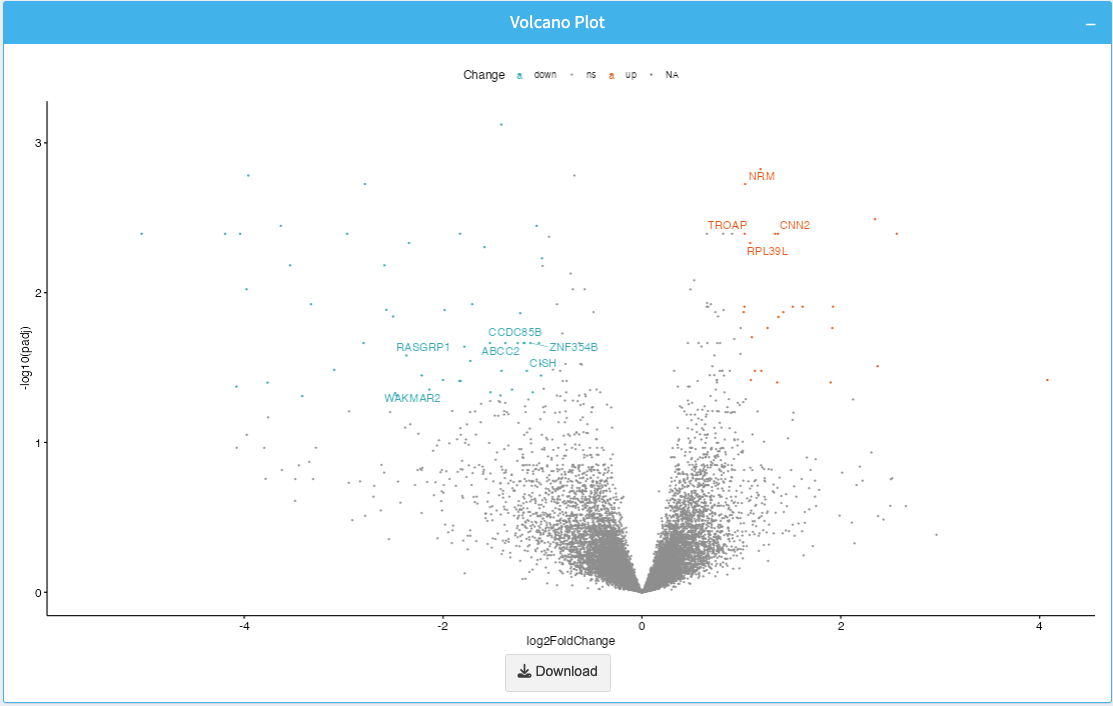
The Volcano Plot displays the relationship between log2 fold change and p-value for each gene. It helps identify significant genes with large expression changes.
- X-axis: Log2 Fold Change (log2FC).
- Y-axis: -log10(p-value), showing statistical significance.
- Highlighted points represent significant genes.
The plot is downloadable as an image via the Download button.
Troubleshooting
- Ensure the Log2FC Cutoff and p-adjust Cutoff values are appropriate for your data.
- If no genes appear in the plot, try lowering the Log2FC or increasing the Top DE Genes count.
- Make sure you select the correct dataset before plotting.
Contact the system administrator if you encounter issues beyond these guidelines.
Heatmap
Volcano Plot
Veen Diagram Analysis
Venn Diagram Analysis - Help Guide
This guide provides instructions on how to use the Venn Diagram Analysis tool to compare multiple datasets and identify overlapping and unique genes among them.
1. Dataset Select
Select one or more datasets using the CPMOAD ID dropdown. You can analyze overlaps across multiple datasets by adding them from the list (e.g., R0001, R0002, R0003).
2. DE Parameters
- Log2FC Cutoff: Specify the minimum log2 fold-change value to filter genes. Adjust this to refine your results based on the significance of gene expression changes.
- p-adjust Cutoff: Set the threshold for adjusted p-values to filter statistically significant genes. A smaller cutoff shows only the most significant overlaps.
3. Log2 Fold Change Direction
- Both: Display both upregulated and downregulated genes.
- Up: Show only upregulated genes.
- Down: Display only downregulated genes.
4. Differential Methods
Select the analysis method:
- DESeq2: Recommended for RNA-Seq datasets with small sample sizes.
- EdgeR: Suitable for datasets with biological replicates.
5. Plot Button
Click the Plot button to generate the Venn diagram and intersection table based on the selected parameters.
6. Venn Diagram
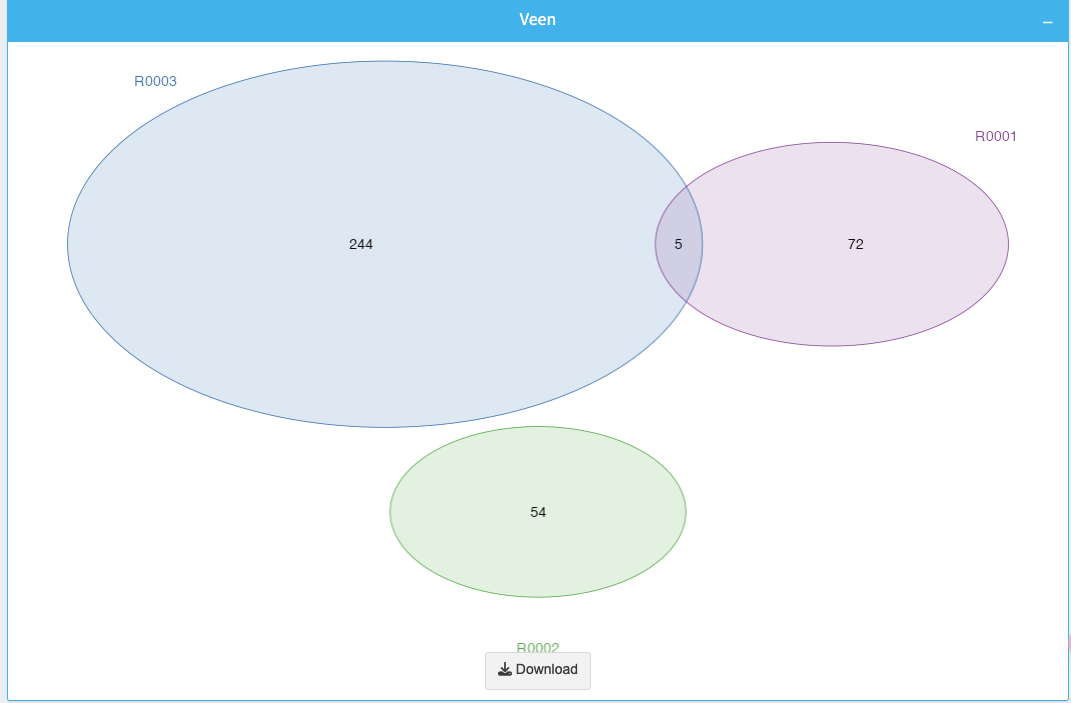
The Venn diagram shows overlapping and unique gene sets among the selected datasets. Each circle represents a dataset, and intersections highlight shared genes.
- Numbers inside the diagram indicate the number of genes in each intersection or set.
- Use this visualization to quickly identify shared or unique gene expressions across datasets.
You can download the Venn diagram using the Download button below the plot.
7. Venn Intersection Info Table
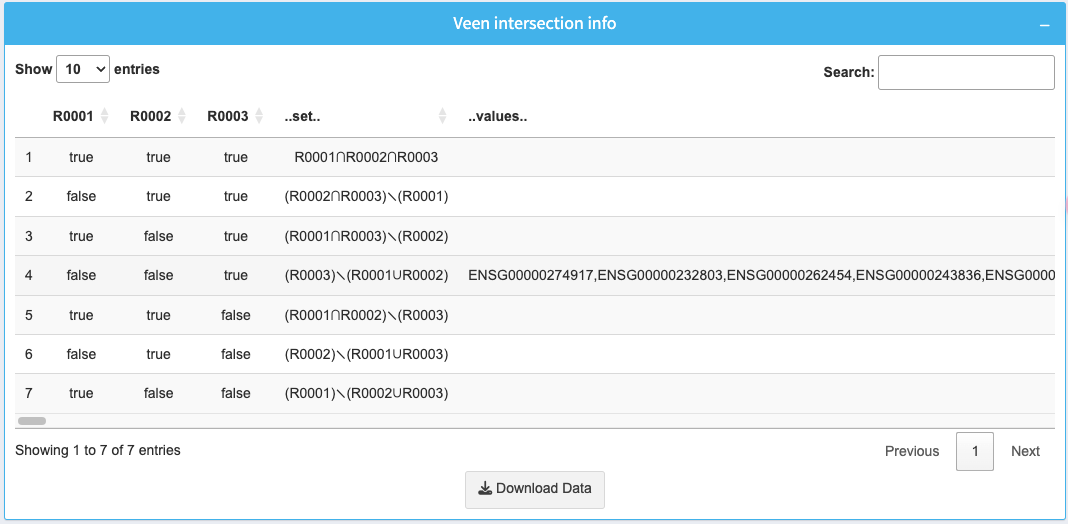
The table below the diagram provides detailed information about the intersections of selected datasets:
- R0001, R0002, R0003: Boolean values indicating whether a gene is present in each dataset.
- .set: Shows which datasets intersect at each row.
- .values: Lists the gene identifiers for each intersection.
Use the search box to filter specific intersections or genes. Download the full table as a CSV by clicking the Download Data button.
Troubleshooting
- If no intersections are found, try reducing the Log2FC Cutoff or increasing the p-adjust Cutoff.
- Ensure multiple datasets are selected to visualize overlaps.
For additional support, contact the system administrator.
Veen
Veen intersection info
KEGG Enrichment Analysis
KEGG Enrichment Analysis - Help Guide
This help document provides detailed instructions on how to use the KEGG Enrichment Analysis tool for identifying significantly enriched biological pathways from gene expression data.
1. Dataset Select
Select the dataset for analysis by choosing the appropriate CPMOAD ID from the dropdown menu. Ensure the dataset aligns with your analysis objectives.
2. DE Parameters
- Log2FC Cutoff: Set the minimum log2 fold-change value to filter out genes with low expression changes.
- p-adjust Cutoff: Adjust the threshold for statistical significance. Genes with p-values below this cutoff will be included in the analysis.
3. Log2 Fold Change Direction
- Both: Display both upregulated and downregulated genes.
- Up: Show only upregulated genes.
- Down: Display only downregulated genes.
4. Differential Methods
Select the analysis method to use:
- DESeq2: Ideal for RNA-Seq datasets with limited sample sizes.
- EdgeR: Recommended for datasets with biological replicates and over-dispersed data.
5. Enrichment Parameter
Enrichment p-value Cutoff: Define the p-value threshold for pathway enrichment. Pathways with p-values below this cutoff will be displayed in the results.
6. Generate KEGG Analysis
Click the Go button to perform the KEGG enrichment analysis using the selected parameters and method.
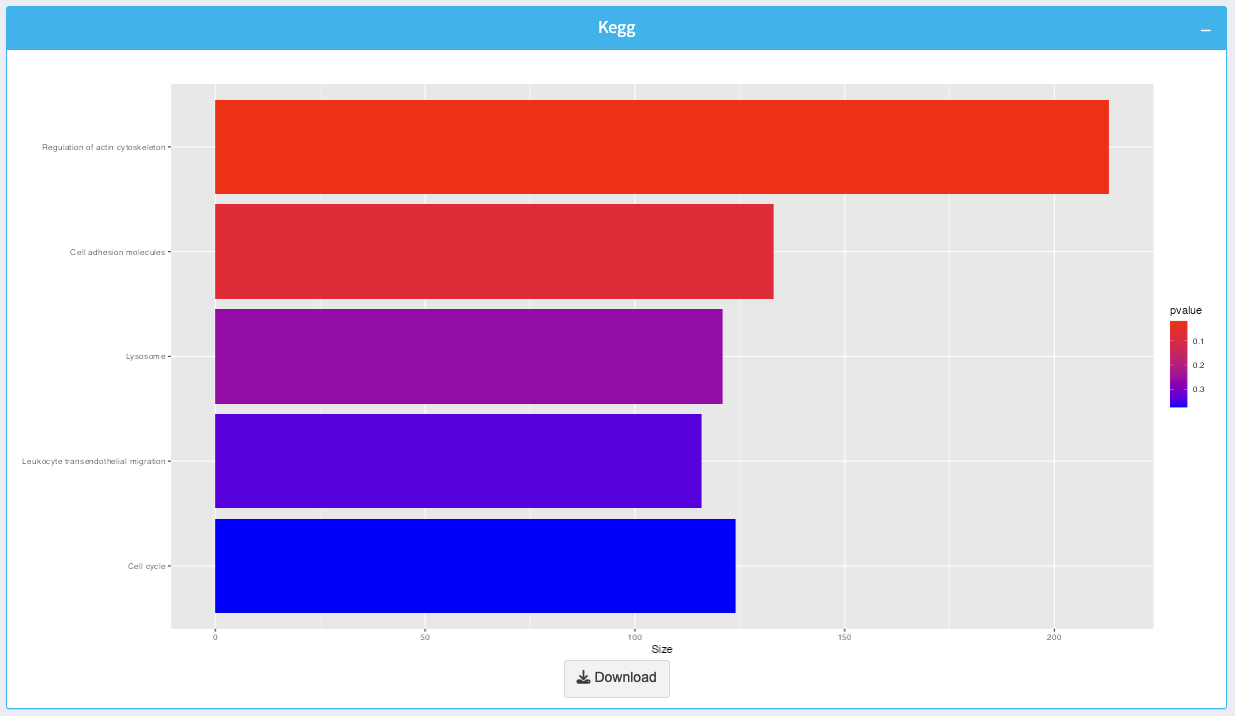
7. KEGG Enrichment Plot
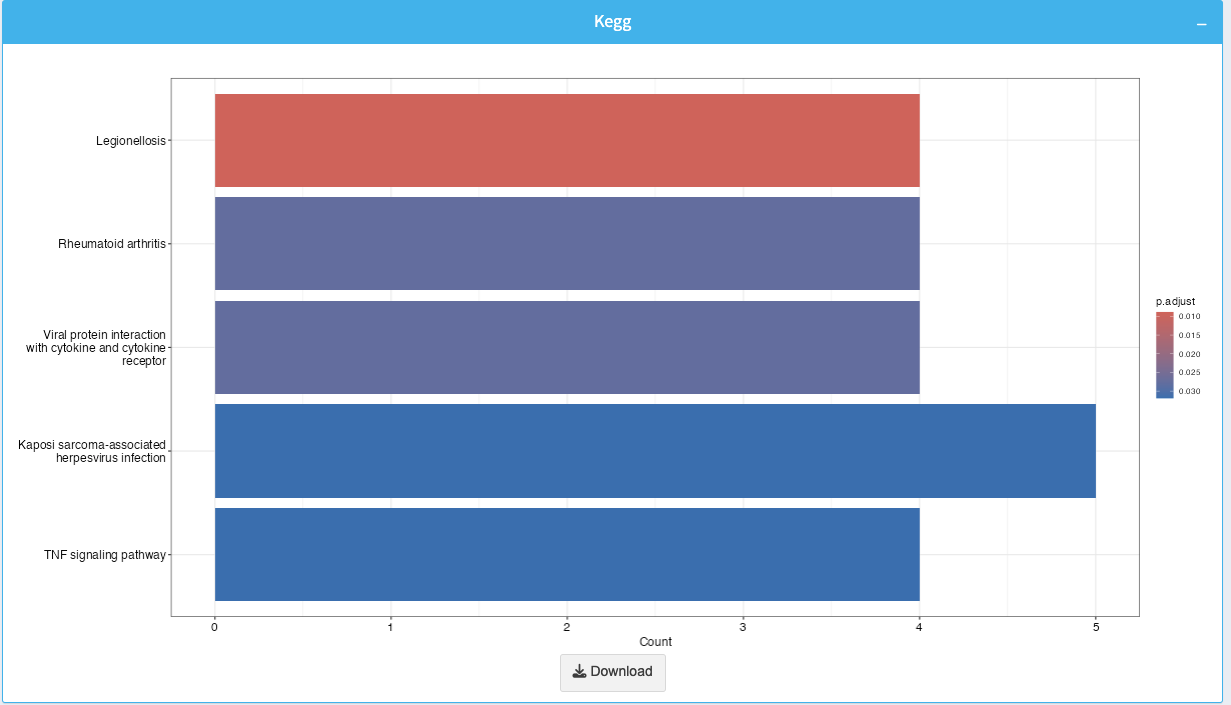
The KEGG enrichment plot visualizes enriched pathways. Each bar represents a pathway, and its length indicates the number of genes contributing to that pathway.
- Color Gradient: Bar colors represent the adjusted p-value, with darker colors indicating lower p-values.
You can download the plot as an image using the Download button.
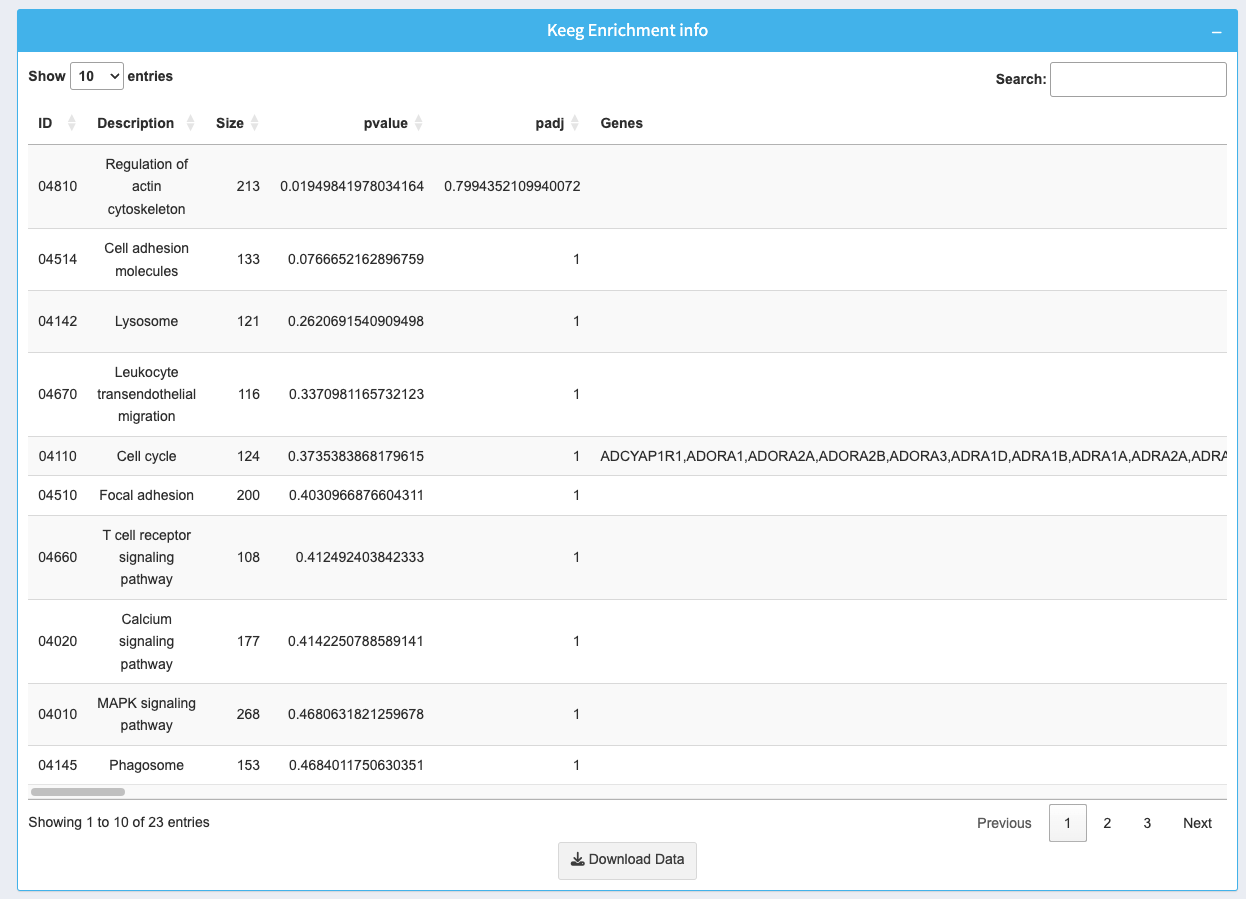
8. KEGG Enrichment Info Table
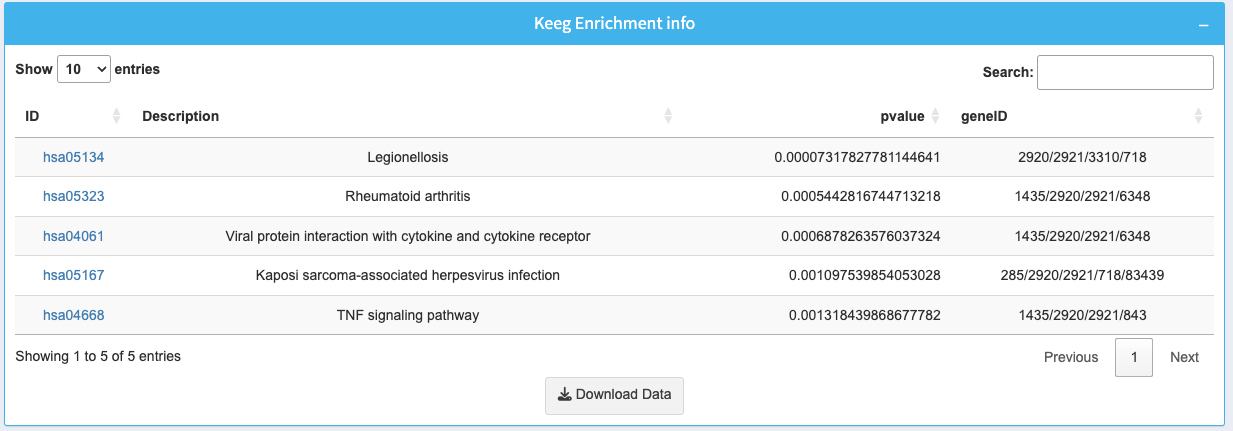
The table provides detailed information about the enriched pathways:
- ID: KEGG pathway identifier with a clickable link for more details.
- Description: Name of the biological pathway.
- p-value: Statistical significance of the enrichment.
- geneID: List of genes involved in the pathway.
Use the search bar to find specific pathways or terms. Download the complete data as a CSV using the Download Data button.
Troubleshooting
- If no pathways appear, adjust the Log2FC Cutoff or increase the p-adjust Cutoff.
- Ensure the dataset contains enough significant genes for enrichment analysis.
If further assistance is needed, contact the system administrator.
KEGG
KEGG Enrichment info
GO Enrichment Analysis
GO Enrichment Analysis - Help Guide
This help document provides detailed instructions on using the GO Enrichment Analysis tool to identify enriched Gene Ontology (GO) terms associated with the input gene data.
1. Dataset Select
Select the dataset for analysis by choosing the appropriate CPMOAD ID from the dropdown menu. Ensure that the dataset contains the genes of interest for GO analysis.
2. DE Parameters
- Log2FC Cutoff: Define the minimum log2 fold-change value for filtering genes with minimal expression changes.
- p-adjust Cutoff: Set the threshold for adjusted p-values. Only genes with p-values below this cutoff will be included in the enrichment analysis.
3. Log2 Fold Change Direction
- Both: Display both upregulated and downregulated genes.
- Up: Show only upregulated genes.
- Down: Display only downregulated genes.
4. Differential Methods
Select the statistical method to use:
- DESeq2: Best suited for RNA-Seq data with smaller sample sizes.
- EdgeR: Recommended for datasets with biological replicates and over-dispersed data.
5. Enrichment Parameter
Enrichment p-value Cutoff: Define the p-value threshold for GO term enrichment. Only GO terms with p-values below this cutoff will be shown in the results.
6. Generate GO Enrichment Analysis
Click the Go button to perform the GO enrichment analysis based on the selected parameters and method.
7. GO Enrichment Plot
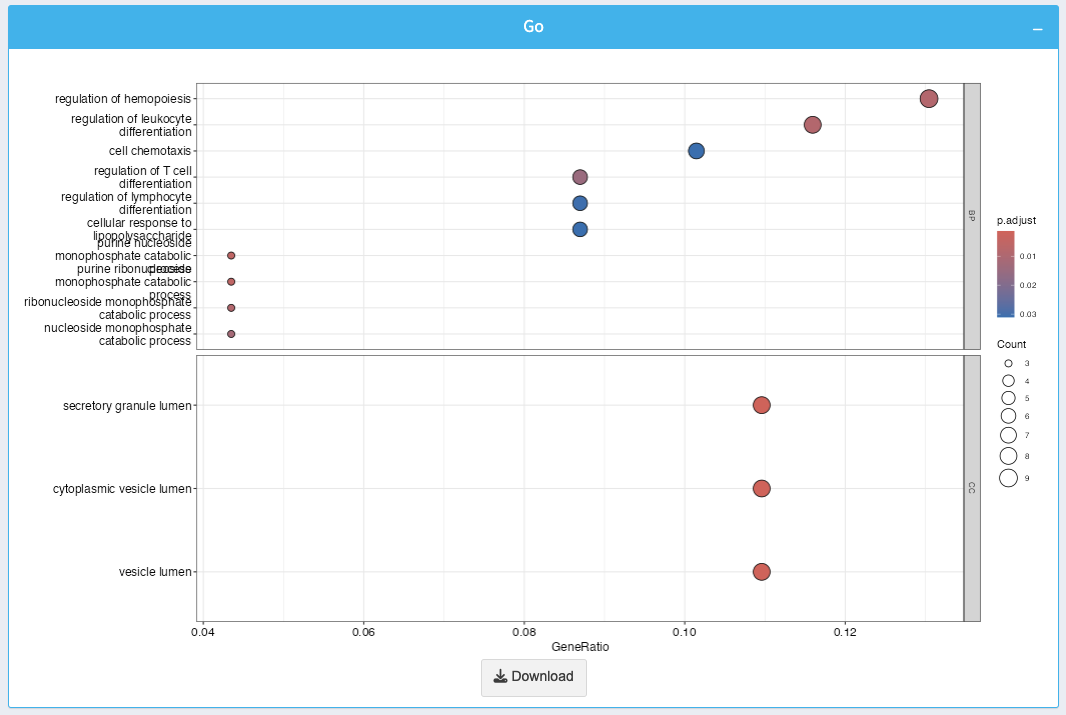
The GO enrichment plot visualizes enriched GO terms along with their significance and gene counts:
- X-axis: GeneRatio, representing the proportion of genes associated with a particular GO term.
- Bubble Size: Indicates the number of genes contributing to the GO term.
- Color Gradient: Represents the adjusted p-value, with darker colors indicating higher significance.
You can download the plot as an image using the Download button.
8. GO Enrichment Info Table
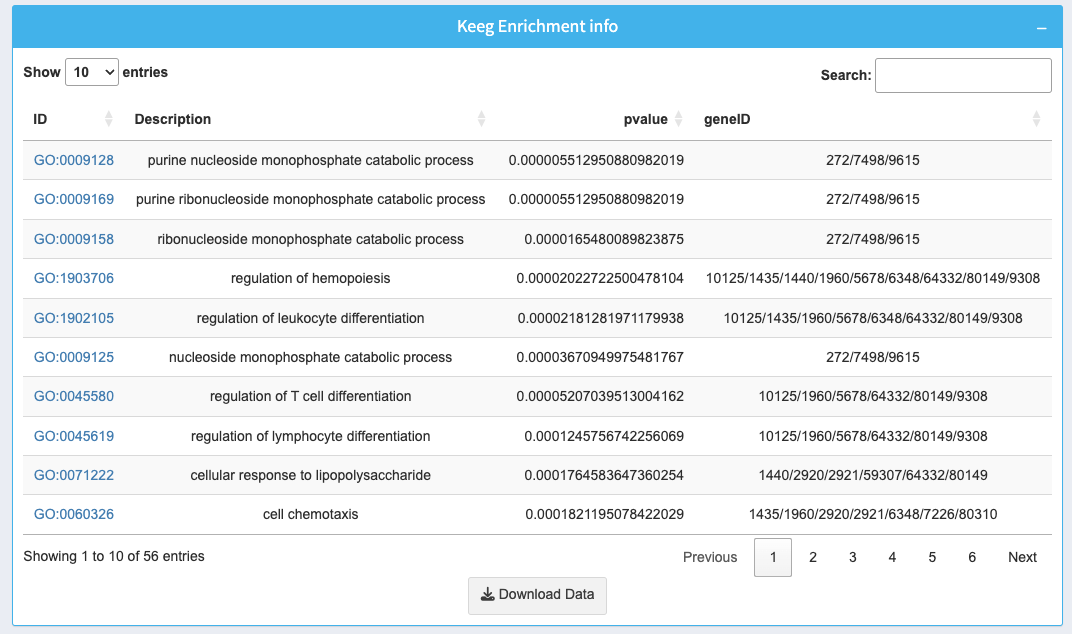
The table below the plot provides detailed information about the enriched GO terms:
- ID: GO term identifier with a clickable link for more details.
- Description: Name of the GO term.
- p-value: Statistical significance of the GO term enrichment.
- geneID: List of genes associated with the GO term.
Use the search bar to filter specific GO terms or gene IDs. Download the full table as a CSV using the Download Data button.
Troubleshooting
- If no GO terms appear, try reducing the Log2FC Cutoff or increasing the p-adjust Cutoff.
- Ensure the dataset contains sufficient significant genes for enrichment analysis.
If you need further assistance, contact the system administrator.
GO
GO Enrichment info
GSEA Analysis
GSEA Analysis - Help Guide
This guide provides instructions on using the Gene Set Enrichment Analysis (GSEA) tool to identify enriched gene sets.
1. Dataset Select
Select the dataset from the dropdown menu using the appropriate CPMOAD ID.
2. DE Parameters
- Log2FC Cutoff: Set the minimum log2 fold-change value to filter low-expression genes.
- p-adjust Cutoff: Set the threshold for adjusted p-values to include significant genes.
3. Log2 Fold Change Direction
- Both: Include both upregulated and downregulated genes.
- Up: Include only upregulated genes.
- Down: Include only downregulated genes.
4. Differential Methods
Select the appropriate method for analysis:
- DESeq2: Suitable for RNA-Seq datasets with small sample sizes.
- EdgeR: Best for datasets with biological replicates.
5. Enrichment Parameter
Select the MSigDB collection to use for enrichment analysis. Below are the available collections and their descriptions:
C1 - Positional Gene Sets
Gene sets corresponding to human chromosome cytogenetic bands.
C2 - Curated Gene Sets
Gene sets derived from online databases, publications, and expert knowledge.
C3 - Regulatory Target Gene Sets
Gene sets based on gene target predictions from microRNA sequences and transcription factor binding sites.
C4 - Computational Gene Sets
Gene sets identified by mining large collections of cancer-oriented expression data.
C5 - Ontology Gene Sets
Gene sets grouped by shared ontology terms.
C6 - Oncogenic Signature Gene Sets
Gene sets defined from microarray data linked to cancer gene perturbations.
C7 - Immunologic Signature Gene Sets
Gene sets representing immune system-related cell states and perturbations.
C8 - Cell Type Signature Gene Sets
Gene sets curated from single-cell sequencing studies focusing on human tissue.
6. Generate GSEA Analysis
Click the Go button to perform the GSEA analysis using the selected parameters and method.
7. GSEA Plot
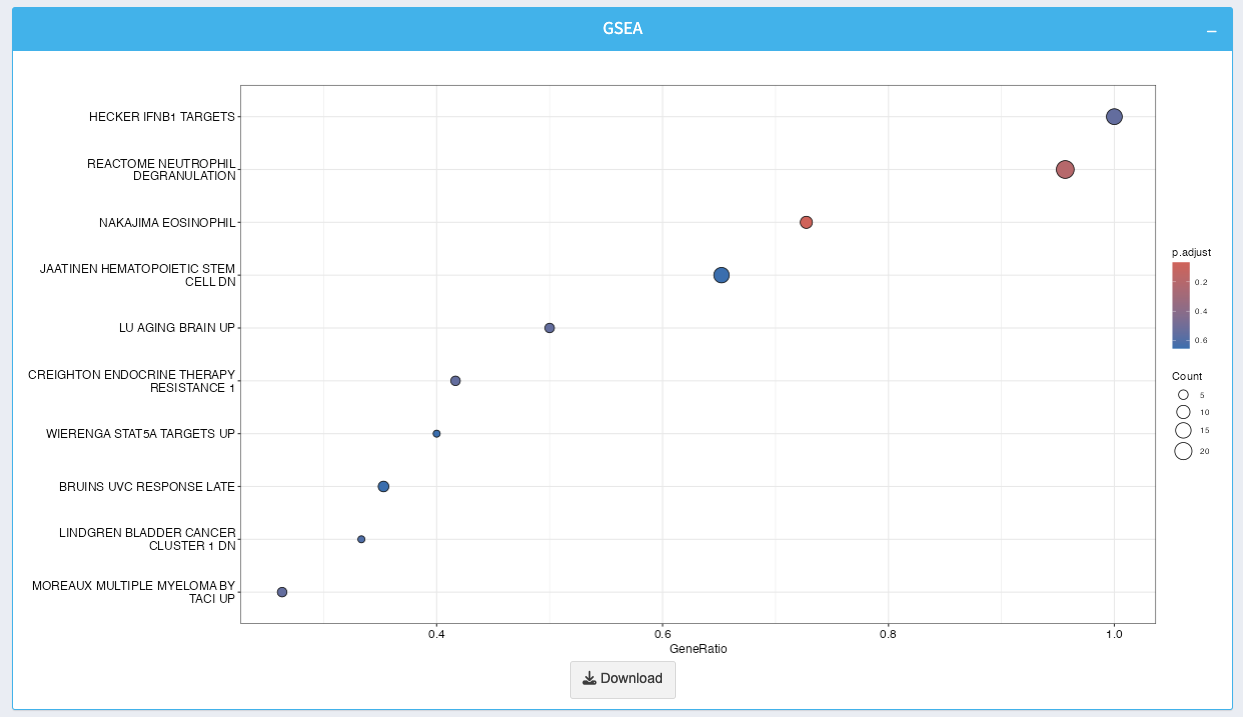
The plot displays enriched gene sets, with points representing individual sets. Use the size and color of the points to interpret gene ratio and significance.
8. GSEA Enrichment Info Table
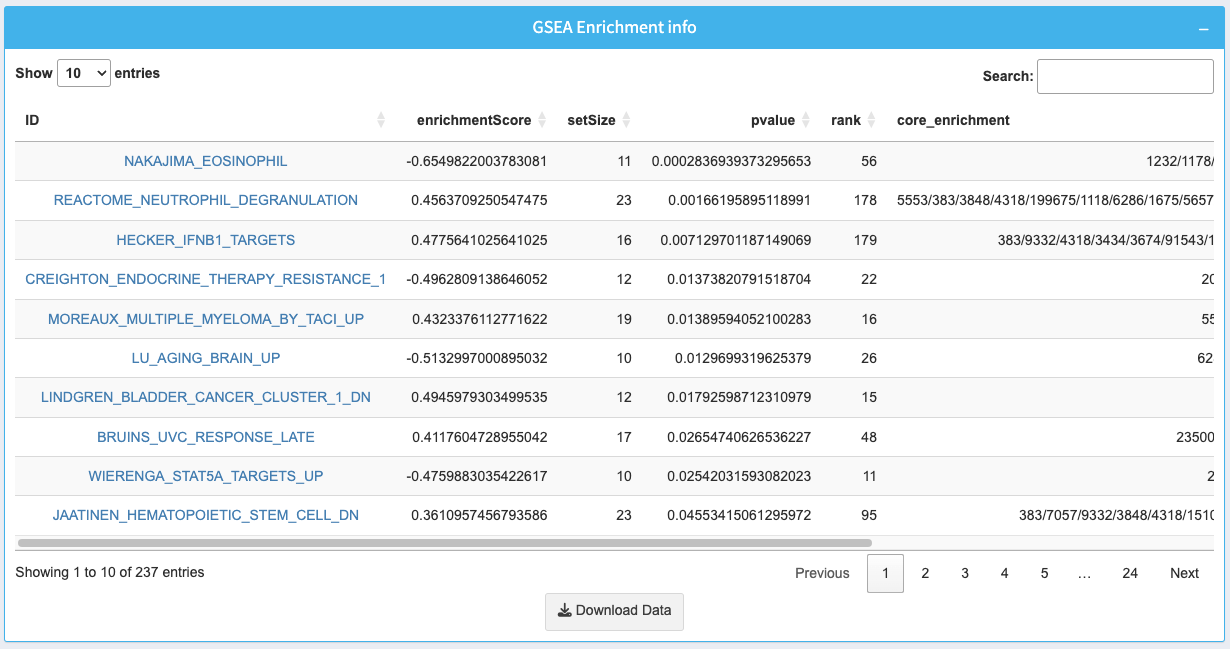
The table provides detailed information about enriched gene sets, including enrichment scores, p-values, and core genes.
Troubleshooting
- Adjust the cutoffs if no gene sets are found.
- Ensure the dataset contains sufficient data for analysis.
Contact the system administrator for additional support.
Methylation Analysis
Methylation Analysis - Help Guide
This help document provides instructions on using the Methylation Analysis tool to explore differential DNA methylation patterns.
1. Dataset Select
Select the dataset from the dropdown using the appropriate CPMOAD ID. The chosen dataset should align with the methylation analysis requirements.
2. DE Parameters
- Methy Diff Cutoff: Set the minimum methylation difference to filter results. Higher values will focus on regions with larger changes in methylation.
- p-value Cutoff: Set the threshold for statistical significance. Only regions with p-values below this cutoff will be included.
3. Differentially Methylated Regions
- All: Display all regions with differential methylation.
- Hyper: Show only hypermethylated regions.
- Hypo: Show only hypomethylated regions.
4. Regions Filter
Use the region filter to focus on specific genomic regions:
- All: Include all genomic regions.
- Promoter: Focus on promoter regions.
- Exon: Display methylation changes in exonic regions.
- Intron: Show changes within intronic regions.
- Distal Intergenic: Include intergenic regions far from known genes.
5. List Button
Click the List button to generate the results table based on the selected parameters and filters.
6. Methylation Analysis Table
The table displays differentially methylated regions (DMRs) with the following columns:
- Chromosome: The chromosome containing the DMR.
- Start: Start position of the region.
- End: End position of the region.
- meth.diff: Difference in methylation levels.
- P.Value: Statistical significance of the methylation change.
- annotation: Functional annotation of the region.
- distanceToTSS: Distance to the nearest transcription start site (TSS).
- ENSEMBL: ENSEMBL gene identifier.
- SYMBOL: Gene symbol associated with the region.
- geneId: Unique gene identifier.
7. Search and Pagination
Use the search box to quickly find specific regions or genes. Navigate through multiple pages using the pagination controls at the bottom of the table.
8. Download Data
Click the Download Data button to export the results as a CSV file for further analysis.
Troubleshooting
- If no results appear, try lowering the Methy Diff Cutoff or increasing the p-value Cutoff.
- Ensure the selected dataset contains valid methylation data.
For additional support, contact the system administrator.
KEGG Enrichment Analysis (Methylation)
KEGG Enrichment Analysis (Methylation) - Help Guide
This guide explains how to use the KEGG Enrichment Analysis tool for methylation data to identify enriched pathways based on DNA methylation patterns.
1. Dataset Select
Select the dataset from the dropdown using its CPMOAD ID. Ensure that the dataset contains methylation data for KEGG pathway enrichment analysis.
2. DE Parameters
- Methy Diff Cutoff: Set the minimum methylation difference to include only regions with significant changes.
- p-value Cutoff: Define the threshold for statistical significance. Regions with p-values below this cutoff will be used for enrichment.
3. Differentially Methylated Regions
- All: Display both hypermethylated and hypomethylated regions.
- Hyper: Show only hypermethylated regions.
- Hypo: Show only hypomethylated regions.
4. Regions Filter
Select specific genomic regions to focus the analysis:
- All: Include all genomic regions.
- Promoter: Focus on promoter regions associated with gene regulation.
- Exon: Include only exonic regions.
- Intron: Focus on intronic regions within genes.
- Distal Intergenic: Include regions far from known genes.
5. Enrichment Parameter
- Enrichment p-value Cutoff: Set the p-value threshold for KEGG pathway enrichment. Only pathways with p-values below this threshold will appear in the results.
6. Generate KEGG Enrichment Analysis
Click the Go button to perform the KEGG enrichment analysis based on the selected parameters.
7. KEGG Enrichment Plot
The KEGG enrichment plot visualizes enriched pathways based on the input data:
- Bars: Represent pathways, with the length indicating the pathway size.
- Color Gradient: Indicates the p-value for enrichment, with brighter colors showing more significant enrichment.
You can download the plot as an image by clicking the Download button.
8. KEGG Enrichment Info Table
The table provides detailed information about enriched pathways:
- ID: KEGG pathway identifier with a clickable link for more information.
- Description: Name of the pathway.
- Size: Number of genes involved in the pathway.
- p-value: Statistical significance of the pathway enrichment.
- padj: Adjusted p-value (FDR) for the pathway.
- Genes: List of genes contributing to the pathway.
Use the search box to find specific pathways or terms. Download the full table as a CSV using the Download Data button.
Troubleshooting
- If no pathways appear, try lowering the Methy Diff Cutoff or increasing the p-value Cutoff.
- Ensure the selected dataset contains significant methylation data for meaningful enrichment analysis.
For further assistance, contact the system administrator.
KEGG Results
KEGG Enrichment info
GO Enrichment Analysis (Methylation)
GO Enrichment Analysis (Methylation) - Help Guide
This guide provides instructions for using the GO Enrichment Analysis tool to analyze DNA methylation data and identify enriched Gene Ontology (GO) terms.
1. Dataset Select
Select the dataset for analysis using its CPMOAD ID from the dropdown menu. Ensure that the selected dataset contains methylation data relevant to your study.
2. DE Parameters
- Methy Diff Cutoff: Set the minimum difference in methylation levels to filter out regions with insignificant changes.
- p-value Cutoff: Define the threshold for statistical significance. Only regions with p-values below this cutoff will be included in the enrichment analysis.
3. Differentially Methylated Regions
- All: Display both hypermethylated and hypomethylated regions.
- Hyper: Show only hypermethylated regions.
- Hypo: Show only hypomethylated regions.
4. Regions Filter
Choose specific genomic regions to focus on:
- All: Include all types of genomic regions.
- Promoter: Focus on promoter regions associated with gene regulation.
- Exon: Include only exonic regions within genes.
- Intron: Focus on intronic regions inside genes.
- Distal Intergenic: Include intergenic regions located far from known genes.
5. Enrichment Parameter
- Enrichment p-value Cutoff: Set the p-value threshold for GO term enrichment. Only GO terms with p-values below this cutoff will appear in the results.
6. Generate GO Enrichment Analysis
Click the Go button to perform the enrichment analysis with the selected parameters and filters.
7. GO Enrichment Plot
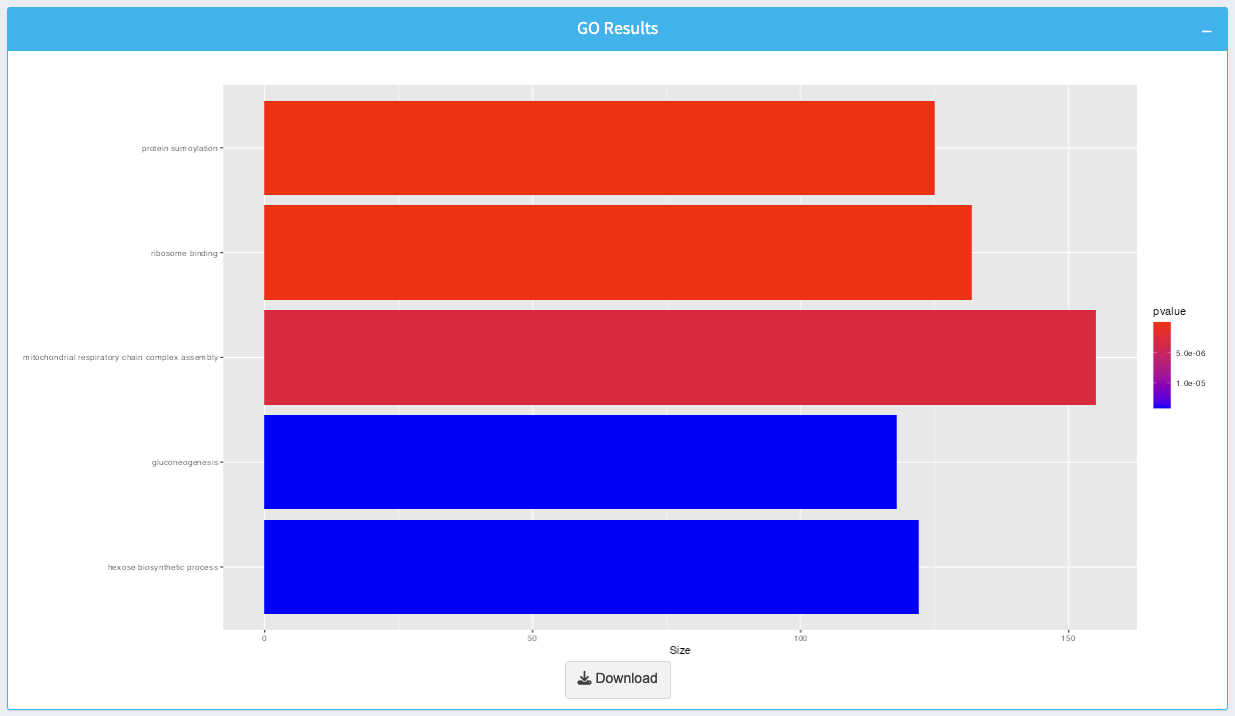
The plot visualizes the enriched GO terms based on the selected parameters:
- Bars: Represent enriched GO terms, with the length indicating the size of each term.
- Color Gradient: Displays the p-value for enrichment, with brighter colors representing higher significance.
Click the Download button to export the plot as an image.
8. GO Enrichment Info Table
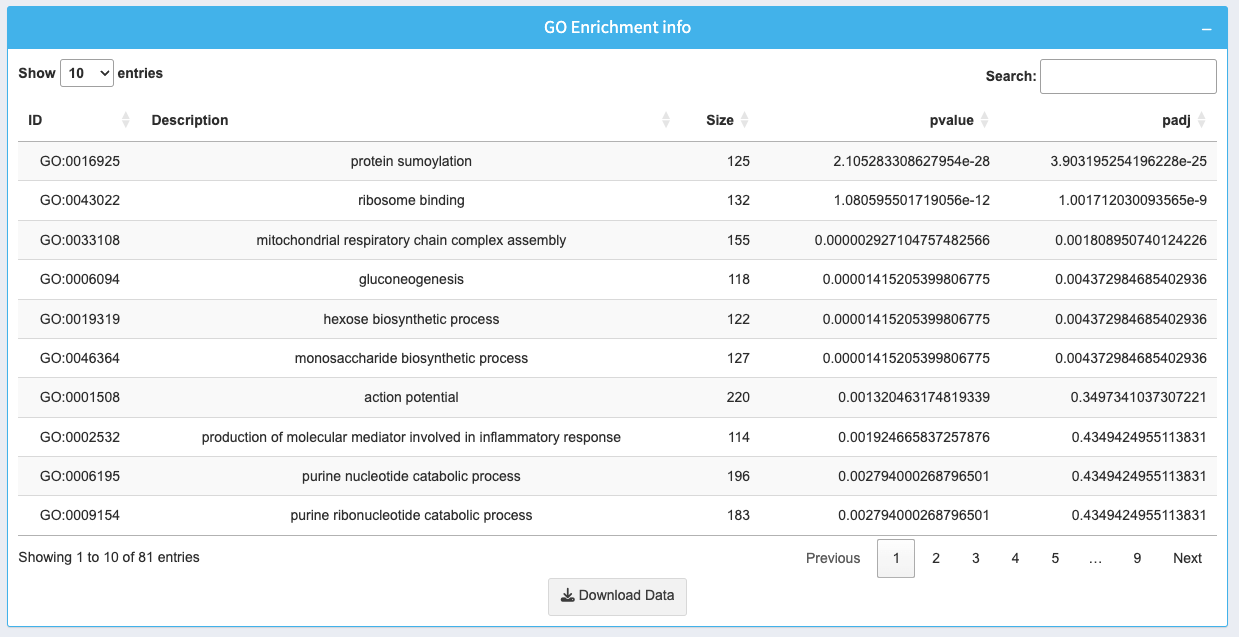
The table provides detailed information about the enriched GO terms:
- ID: GO term identifier with a clickable link for further details.
- Description: Name of the GO term.
- Size: Number of genes associated with the GO term.
- p-value: Significance of the enrichment for the term.
- padj: Adjusted p-value (FDR) for multiple testing correction.
Use the search box to find specific terms or genes. Download the entire table as a CSV by clicking Download Data.
Troubleshooting
- If no terms appear, try lowering the Methy Diff Cutoff or increasing the p-value Cutoff.
- Ensure the dataset contains relevant methylation data for meaningful enrichment.
For further assistance, contact the system administrator.
GO Results
GO Enrichment info
Reactome Enrichment Analysis (Methylation)
Reactome Enrichment Analysis (Methylation) - Help Guide
This guide explains how to use the Reactome Enrichment Analysis tool to identify biological pathways associated with methylation changes in your dataset.
1. Dataset Select
Select the dataset for analysis by choosing the appropriate CPMOAD ID from the dropdown. Ensure the selected dataset contains relevant methylation data for pathway enrichment.
2. DE Parameters
- Methy Diff Cutoff: Set the minimum methylation difference to filter regions with small changes.
- p-value Cutoff: Define the threshold for statistical significance. Only regions with p-values below this cutoff will be included in the enrichment analysis.
3. Differentially Methylated Regions
- All: Display both hypermethylated and hypomethylated regions.
- Hyper: Show only hypermethylated regions.
- Hypo: Show only hypomethylated regions.
4. Regions Filter
Choose the genomic regions to focus on:
- All: Include all types of genomic regions.
- Promoter: Focus on promoter regions involved in gene regulation.
- Exon: Include exonic regions within genes.
- Intron: Focus on intronic regions inside genes.
- Distal Intergenic: Include regions located far from known genes.
5. Enrichment Parameter
- Enrichment p-value Cutoff: Set the p-value threshold for pathway enrichment. Only pathways with p-values below this cutoff will be displayed.
6. Generate Reactome Enrichment Analysis
Click the Go button to perform the enrichment analysis based on the selected parameters.
7. Reactome Enrichment Plot
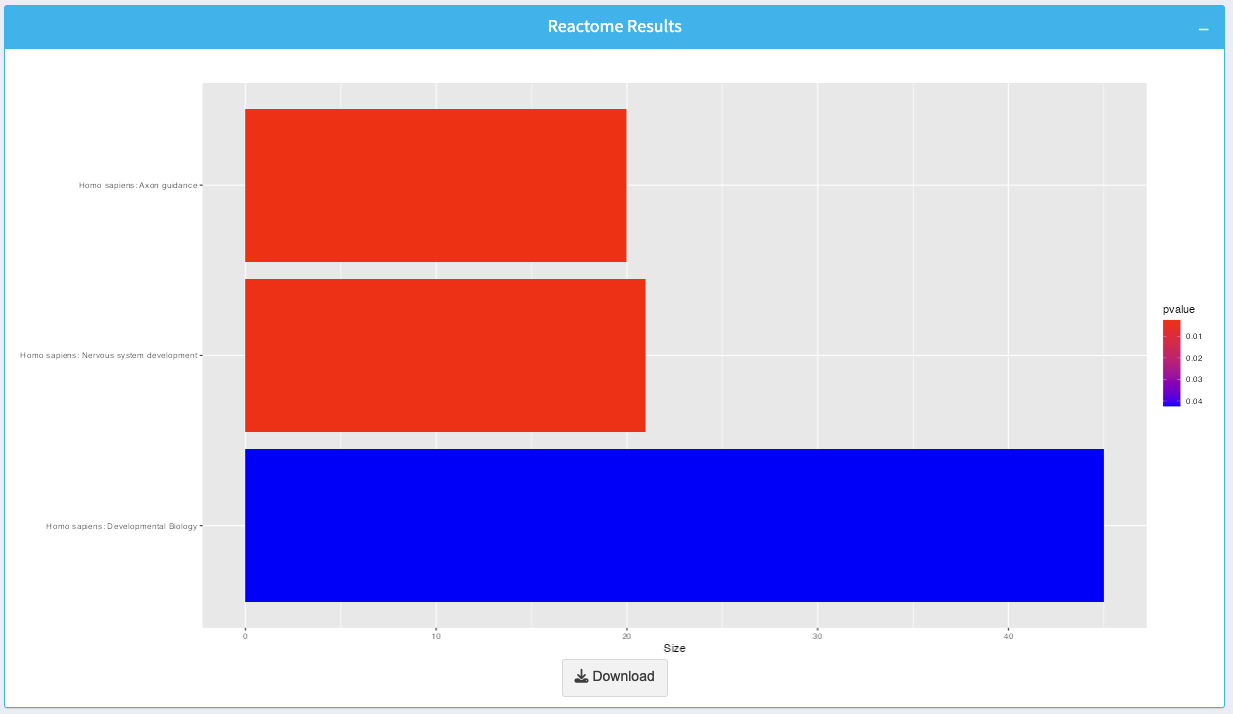
The plot visualizes enriched Reactome pathways:
- Bars: Represent individual pathways, with the length indicating the pathway size.
- Color Gradient: Represents the p-value for enrichment, with brighter colors indicating more significant pathways.
You can download the plot as an image by clicking the Download button.
8. Reactome Enrichment Info Table
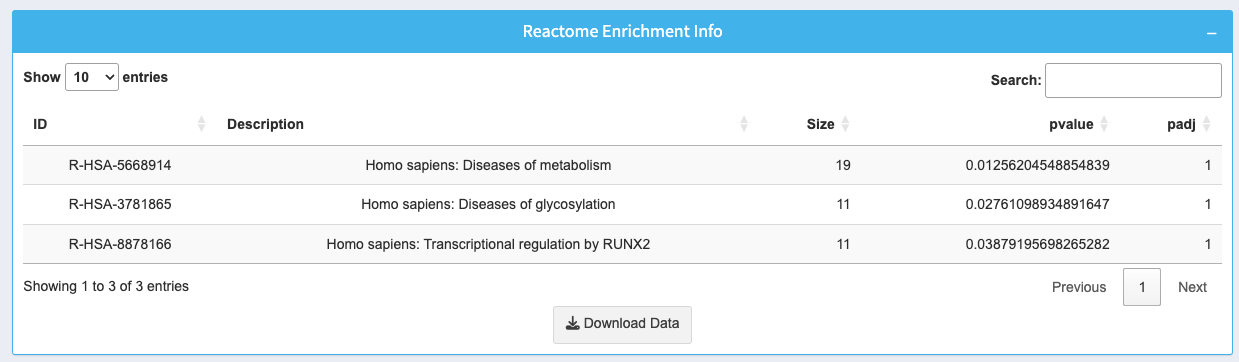
The table provides detailed information about enriched pathways:
- ID: Reactome pathway identifier with a clickable link for more information.
- Description: Name of the Reactome pathway.
- Size: Number of genes involved in the pathway.
- p-value: Significance level of the pathway enrichment.
- padj: Adjusted p-value for multiple testing correction.
Use the search box to find specific pathways. Download the entire table as a CSV using the Download Data button.
Troubleshooting
- If no pathways are displayed, try lowering the Methy Diff Cutoff or increasing the p-value Cutoff.
- Ensure the selected dataset contains sufficient methylation data for meaningful enrichment analysis.
If further assistance is needed, contact the system administrator.
Reactome Results
Reactome Enrichment info
GSEA Ananlysis (Methylation)
GSEA Analysis (Methylation) - Help Guide
This guide provides detailed instructions on how to use the GSEA Analysis tool for analyzing DNA methylation data to identify enriched gene sets.
1. Dataset Select
Select the dataset from the dropdown using its CPMOAD ID. Ensure the selected dataset contains relevant methylation data for GSEA analysis.
2. DE Parameters
- Methy Diff Cutoff: Set the minimum methylation difference to include only regions with meaningful changes.
- p-value Cutoff: Define the significance threshold. Only regions with p-values below this cutoff will be considered in the analysis.
3. Differentially Methylated Regions
- All: Display both hypermethylated and hypomethylated regions.
- Hyper: Show only hypermethylated regions.
- Hypo: Show only hypomethylated regions.
4. Regions Filter
Focus the analysis on specific genomic regions:
- All: Include all genomic regions.
- Promoter: Focus on promoter regions near gene transcription start sites.
- Exon: Include only exonic regions within genes.
- Intron: Focus on intronic regions inside genes.
- Distal Intergenic: Include regions far from known genes.
5. Enrichment Parameter
- Enrichment p-value Cutoff: Set the p-value threshold for identifying enriched gene sets. Only gene sets with p-values below this threshold will appear in the results.
6. Generate GSEA Analysis
Click the Go button to perform the GSEA analysis using the selected parameters.
7. GSEA Enrichment Plot
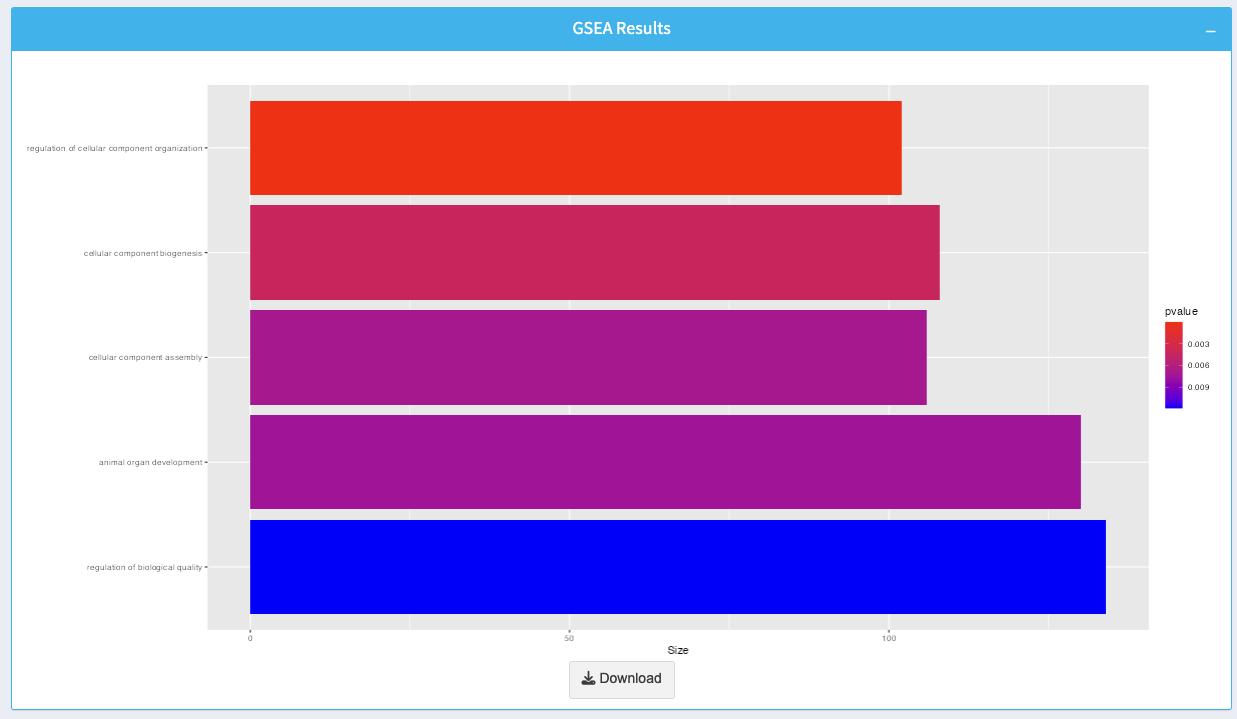
The GSEA plot visualizes the enriched gene sets:
- Bars: Represent gene sets, with the length indicating the size of each set.
- Color Gradient: Indicates the p-value for enrichment, with brighter colors representing more significant enrichment.
You can download the plot as an image by clicking the Download button.
8. GSEA Enrichment Info Table
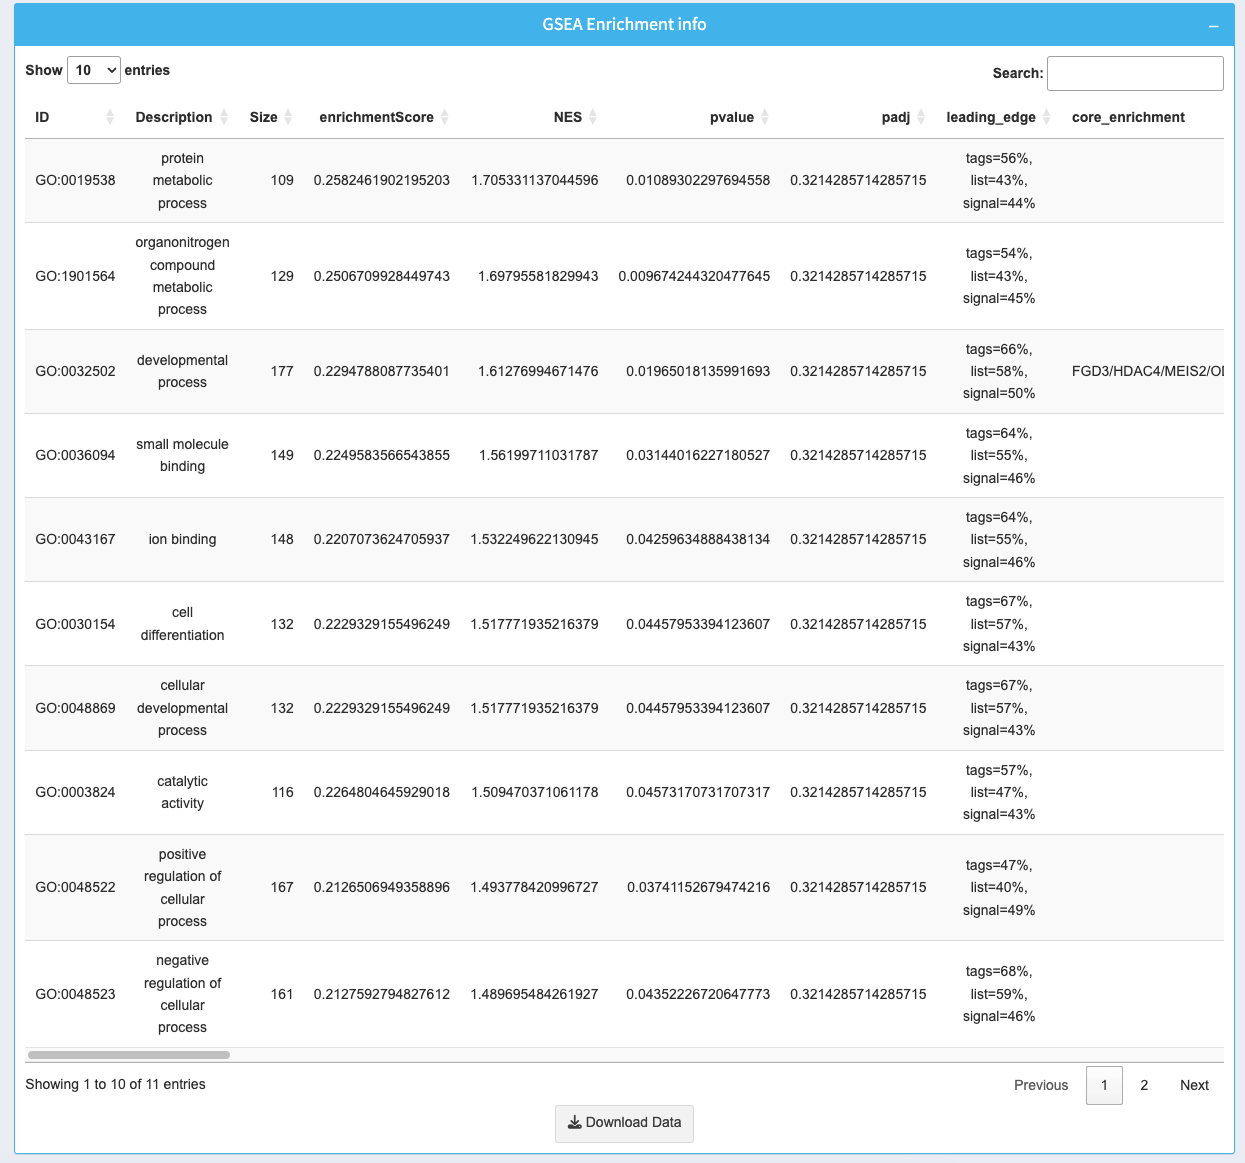
The table provides detailed information about the enriched gene sets:
- ID: Gene set identifier with a clickable link for further details.
- Description: Name of the gene set.
- Size: Number of genes in the gene set.
- enrichmentScore: The score indicating the degree of enrichment.
- NES: Normalized enrichment score for cross-sample comparison.
- p-value: Statistical significance of the enrichment.
- padj: Adjusted p-value (FDR) for multiple testing correction.
- leading_edge: Genes that drive the enrichment signal.
- core_enrichment: Core genes responsible for the enrichment.
Use the search box to quickly find specific gene sets or terms. Download the entire table as a CSV using the Download Data button.
Troubleshooting
- If no enriched gene sets appear, try lowering the Methy Diff Cutoff or increasing the p-value Cutoff.
- Ensure the dataset contains enough data for meaningful GSEA analysis.
For further assistance, contact the system administrator.
GSEA Results
GSEA Enrichment info
Over-representation Analysis (Methylation)
Over-representation Analysis (Methylation) - Help Guide
This help guide provides detailed instructions for using the Over-representation Analysis (ORA) tool for methylation data to identify enriched biological processes or pathways.
1. Dataset Select
Select the appropriate dataset for analysis from the dropdown menu using its CPMOAD ID. Ensure the selected dataset contains relevant methylation data for ORA.
2. DE Parameters
- Methy Diff Cutoff: Set the minimum difference in methylation levels to include only meaningful changes in the analysis.
- p-value Cutoff: Define the threshold for statistical significance. Only regions with p-values below this cutoff will be used for enrichment.
3. Differentially Methylated Regions
- All: Display both hypermethylated and hypomethylated regions.
- Hyper: Show only hypermethylated regions.
- Hypo: Show only hypomethylated regions.
4. Regions Filter
Focus the analysis on specific genomic regions:
- All: Include all genomic regions in the analysis.
- Promoter: Focus on promoter regions near gene transcription start sites.
- Exon: Include only exonic regions.
- Intron: Include only intronic regions.
- Distal Intergenic: Include regions far from known genes.
5. Enrichment Parameter
- Enrichment p-value Cutoff: Set the p-value threshold for pathway or process enrichment. Only those with p-values below this cutoff will appear in the results.
6. Generate ORA Analysis
Click the Go button to generate the ORA results using the selected parameters and filters.
7. ORA Results Plot
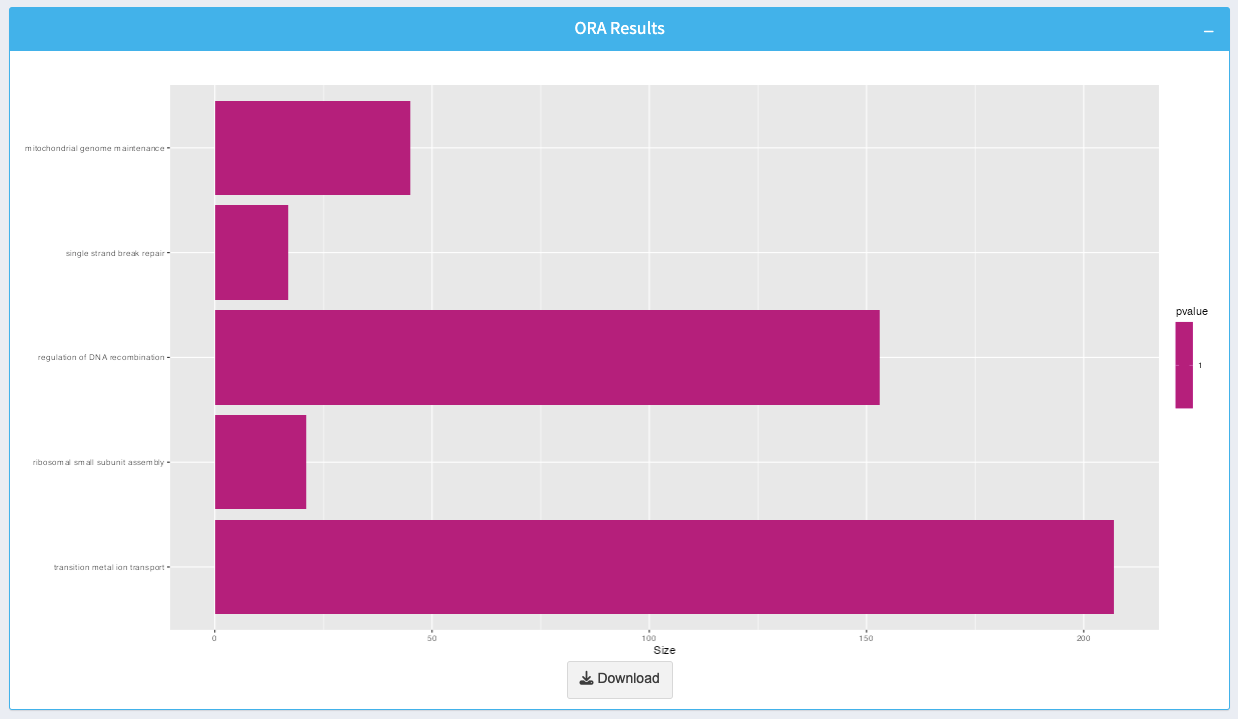
The plot visualizes the enriched biological processes or pathways:
- Bars: Represent individual processes or pathways, with the length indicating the size of each set.
- Color Gradient: Indicates the p-value for enrichment, with more intense colors representing higher significance.
You can download the plot as an image by clicking the Download button.
8. ORA Enrichment Info Table
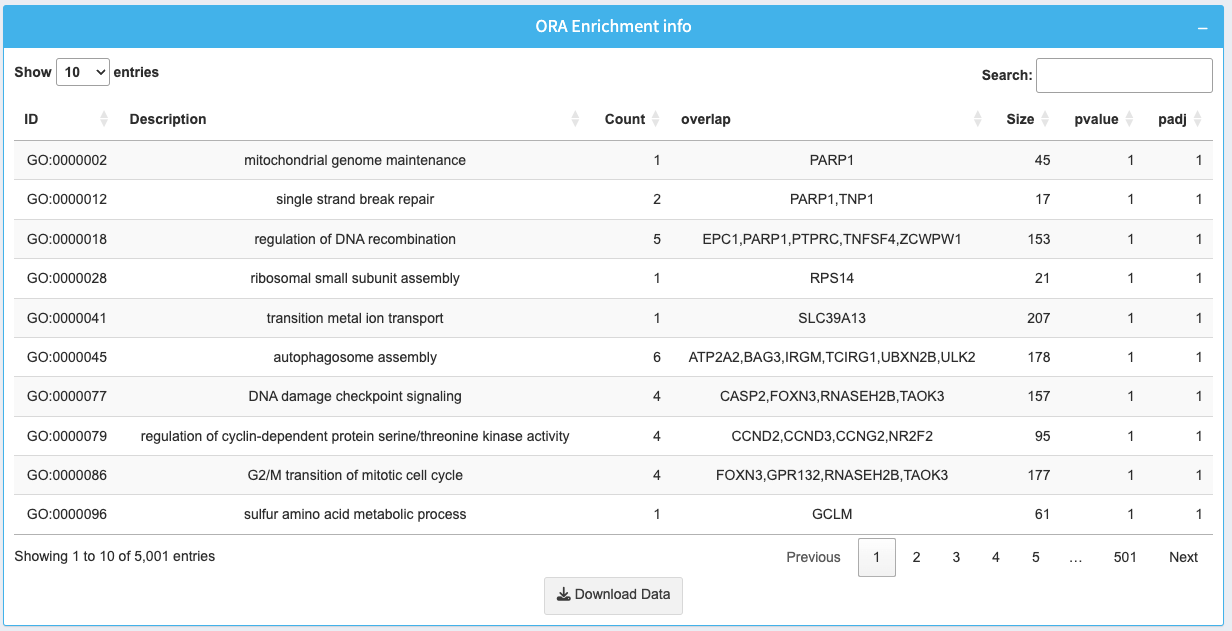
The table provides detailed information about the enriched processes or pathways:
- ID: Identifier for the biological process or pathway.
- Description: Name of the biological process or pathway.
- Count: Total number of genes in the pathway.
- overlap: List of genes contributing to the enrichment.
- Size: Total size of the pathway or process.
- p-value: Statistical significance of the enrichment.
- padj: Adjusted p-value for multiple testing correction.
Use the search box to quickly find specific pathways or terms. Download the entire table as a CSV using the Download Data button.
Troubleshooting
- If no results are displayed, try lowering the Methy Diff Cutoff or increasing the p-value Cutoff.
- Ensure that the selected dataset contains relevant methylation data for meaningful ORA results.
For further assistance, please contact the system administrator.
ORA Results
ORA Enrichment info
Differential Expression Analysis (ncRNA)
Differential Expression Analysis (ncRNA) - Help Guide
This help guide explains how to use the Differential Expression Analysis tool for non-coding RNA (ncRNA) data to identify differentially expressed miRNAs or other ncRNAs.
1. Dataset Select
Select the appropriate dataset using the CPMOAD ID from the dropdown menu. Ensure the selected dataset contains relevant ncRNA data.
2. DE Parameters
- Log2FC Cutoff: Set the minimum log2 fold-change value to filter ncRNAs with insignificant expression changes.
- p-value Cutoff: Define the threshold for statistical significance. Only ncRNAs with p-values below this cutoff will be included in the results.
3. Differential Methods
Select the statistical method used for differential expression analysis:
- DESeq2: Suitable for datasets with smaller sample sizes and RNA-Seq data.
- EdgeR: Recommended for data with biological replicates and over-dispersed count distributions.
4. List Button
Click the List button to generate the table of differentially expressed ncRNAs based on the selected parameters.
5. Differential Expression Table
The table displays the results of the analysis with the following columns:
- baseMean: Average expression level of the ncRNA across all samples.
- log2FoldChange: Log2-transformed fold change between conditions.
- lfcSE: Standard error of the log2 fold change.
- stat: Test statistic for the differential expression analysis.
- p-value: Raw p-value indicating statistical significance.
- padj: Adjusted p-value (FDR) for multiple testing correction.
6. Search and Pagination
Use the search box to find specific ncRNAs by their ID or other attributes. Navigate through pages using the pagination controls at the bottom of the table.
7. Download Data
Click the Download Data button to export the complete analysis results as a CSV file for further analysis.
Troubleshooting
- If no results appear, try lowering the Log2FC Cutoff or increasing the p-value Cutoff.
- Ensure the correct dataset is selected and that it contains sufficient data for analysis.
For further assistance, contact the system administrator.
Heatmap & Volcano (ncRNA)
Heatmap & Volcano Plot (ncRNA) - Help Guide
This help guide provides detailed instructions on how to use the Heatmap & Volcano Plot tool for visualizing differentially expressed non-coding RNAs (ncRNAs).
1. Dataset Select
Select the appropriate dataset using the CPMOAD ID from the dropdown. Ensure the selected dataset contains the ncRNA data you wish to analyze.
2. DE Parameters
- Log2FC Cutoff: Set the minimum log2 fold-change value to filter out ncRNAs with minor expression changes.
- p-value Cutoff: Define the significance threshold. Only ncRNAs with p-values below this cutoff will be included in the analysis.
3. Differential Methods
Select the statistical method to use for differential expression analysis:
- DESeq2: Ideal for RNA-Seq data with smaller sample sizes.
- EdgeR: Recommended for datasets with biological replicates.
4. Top DE Genes Slider
Use the slider to adjust the number of top differentially expressed ncRNAs to display in the plots, ranging from 10 to 100.
5. Plot Button
Click the Plot button to generate the heatmap and volcano plot based on the selected parameters.
6. Heatmap
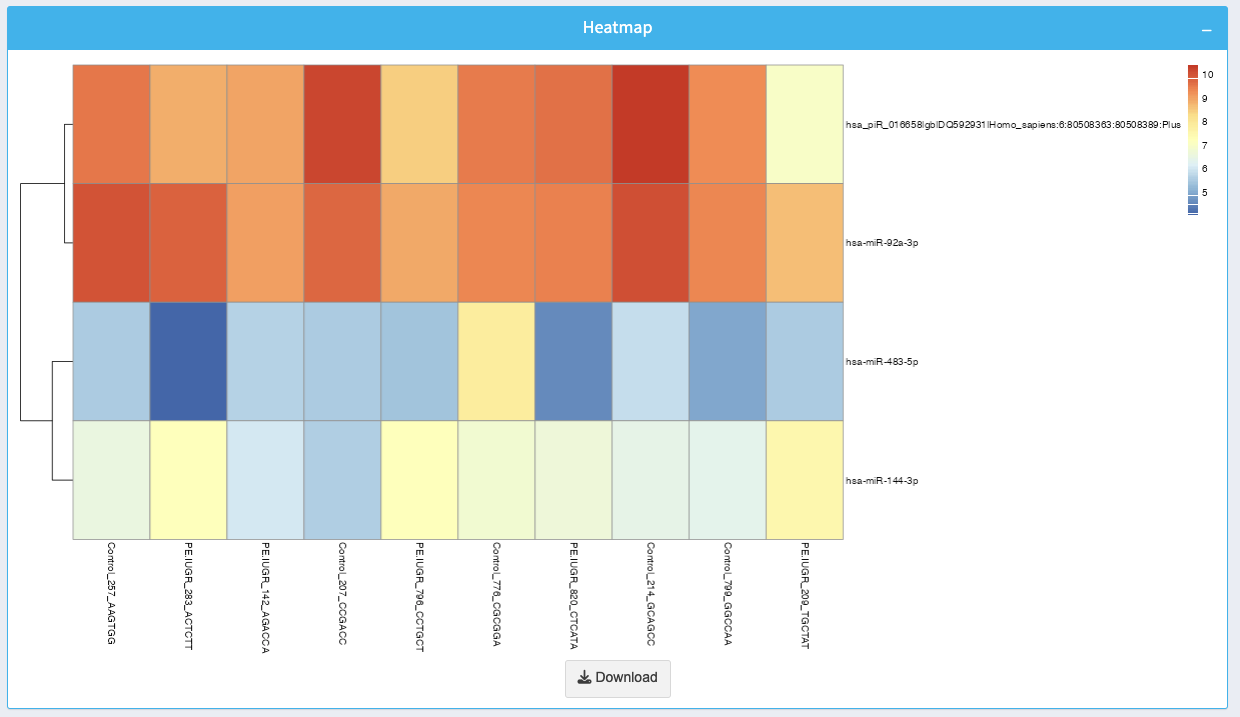
The heatmap visualizes the expression levels of the top differentially expressed ncRNAs across multiple samples:
- Color Gradient: Red represents high expression, while blue represents low expression.
- Use the heatmap to identify clusters of ncRNAs with similar expression patterns across samples.
You can download the heatmap as an image by clicking the Download button.
7. Volcano Plot
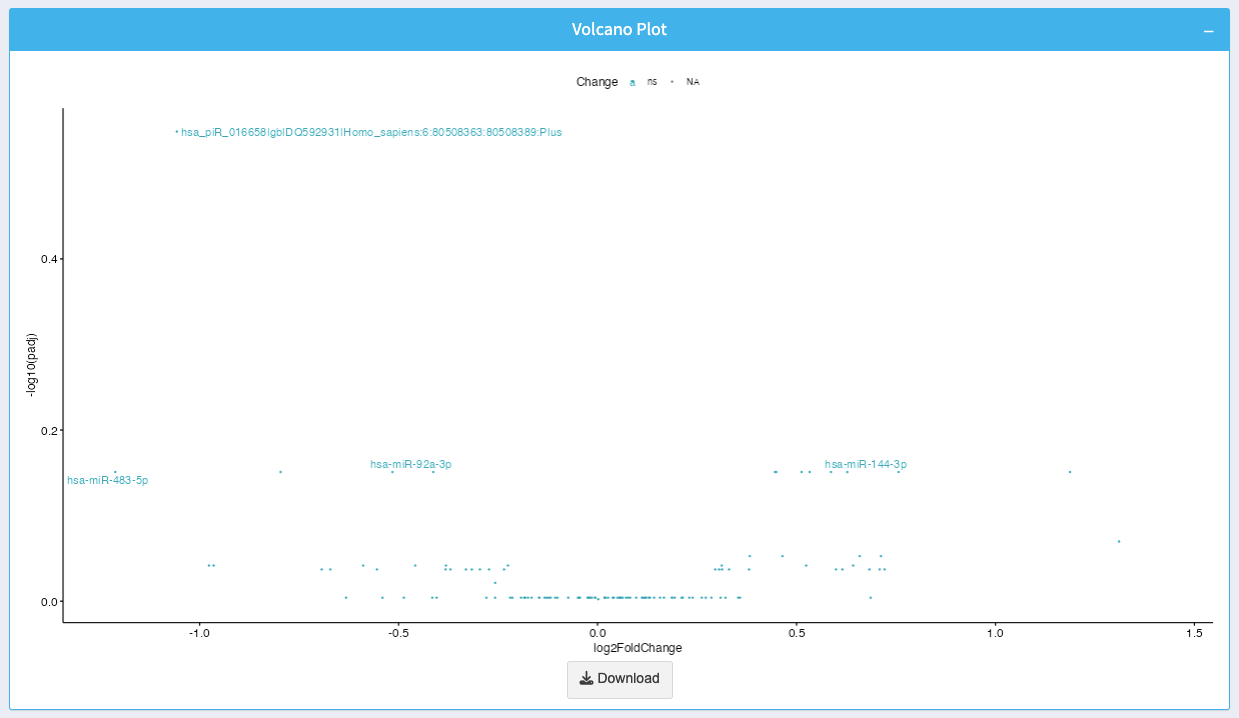
The volcano plot displays the relationship between log2 fold-change and p-value for each ncRNA:
- X-axis: Log2 fold-change representing the magnitude of expression change.
- Y-axis: -log10(p-value) representing the statistical significance of the change.
- Points at the top indicate significant ncRNAs with high expression changes.
You can download the volcano plot as an image by clicking the Download button.
8. Troubleshooting
- If no data appears, try lowering the Log2FC Cutoff or increasing the p-value Cutoff.
- Ensure the selected dataset contains enough significant ncRNA data for visualization.
If further assistance is needed, contact the system administrator.
Heatmap
Volcano Plot
Veen Diagram Analysis (ncRNA)
Venn Diagram Analysis (ncRNA) - Help Guide
This help guide provides instructions on using the Venn Diagram Analysis tool for non-coding RNA (ncRNA) datasets to explore overlaps and unique features across multiple datasets.
1. Dataset Select
Select one or more datasets using the CPMOAD ID dropdown. You can add multiple datasets (e.g., NC0001, NC0002, NC0003) to generate a Venn diagram showing shared and unique ncRNAs across the datasets.
2. DE Parameters
- Log2FC Cutoff: Set the minimum log2 fold-change value to filter ncRNAs with insignificant expression changes.
- p-adjust Cutoff: Define the threshold for adjusted p-values. Only ncRNAs with p-values below this cutoff will be included in the diagram.
3. Differential Methods
Select the method used for differential expression analysis:
- DESeq2: Suitable for RNA-Seq datasets with smaller sample sizes.
- EdgeR: Ideal for datasets with biological replicates and over-dispersed counts.
4. Plot Button
Click the Plot button to generate the Venn diagram and intersection table based on the selected parameters.
5. Venn Diagram
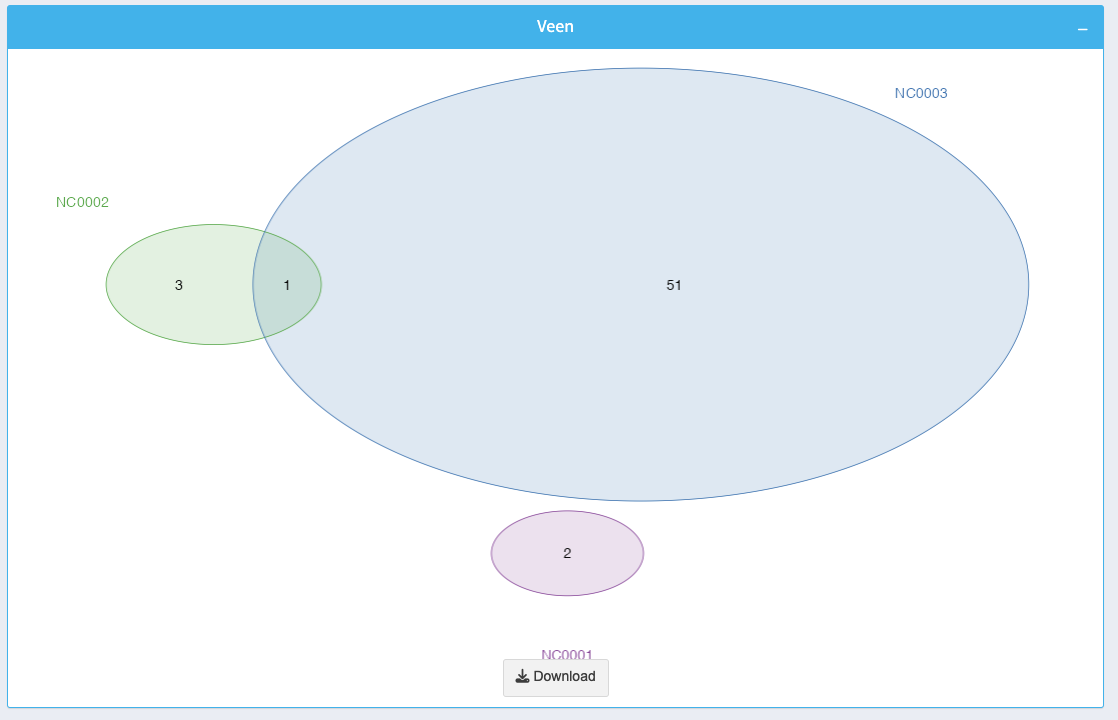
The Venn diagram visualizes the overlaps and unique ncRNAs across the selected datasets:
- Each circle represents a dataset, and overlaps indicate shared ncRNAs.
- The numbers inside each section reflect the count of ncRNAs in that specific region.
You can download the diagram as an image using the Download button.
6. Venn Intersection Info Table
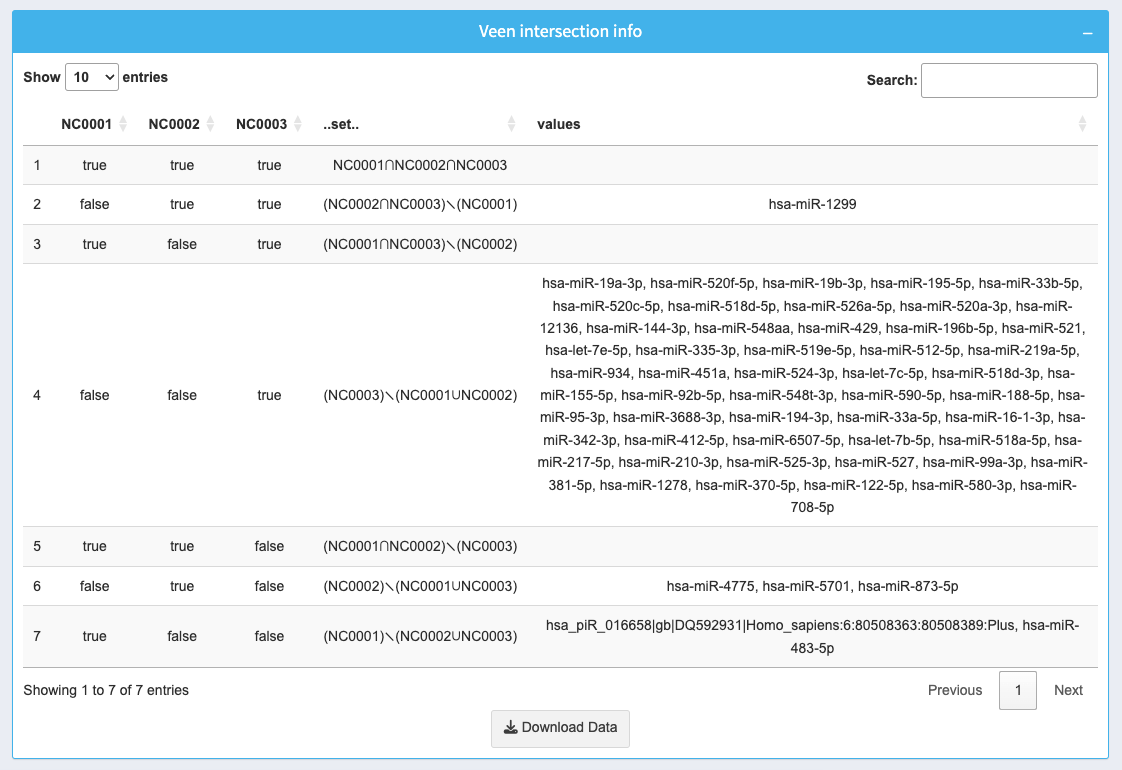
The table provides detailed information about the intersections of selected datasets:
- NC0001, NC0002, NC0003: Boolean values indicating whether an ncRNA is present in each dataset.
- .set: Lists the datasets contributing to each intersection.
- values: Displays the ncRNAs found in the respective intersections.
Use the search box to find specific ncRNAs or intersections. Download the full table as a CSV using the Download Data button.
7. Troubleshooting
- If no intersections are displayed, try adjusting the Log2FC Cutoff or increasing the p-adjust Cutoff.
- Ensure that the selected datasets contain relevant ncRNA data for meaningful comparisons.
For further assistance, contact the system administrator.
Veen
Veen intersection info
miRNA target serach
miRNA Target Search - Help Guide
This help guide provides detailed instructions on using the miRNA Target Search tool to find target genes regulated by specific miRNAs.
1. Input miRNA
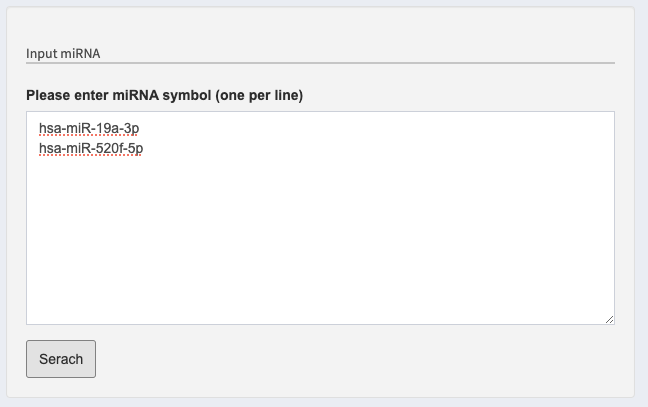
Enter one or more miRNA symbols into the text box, with each symbol on a new line (e.g., hsa-miR-19a-3p, hsa-miR-520f-5p). Ensure the miRNA symbols are correctly formatted to return accurate results.
2. Search Button
Click the Search button to initiate the query. The tool will retrieve and display target genes for the specified miRNAs.
3. Target Search Results Table
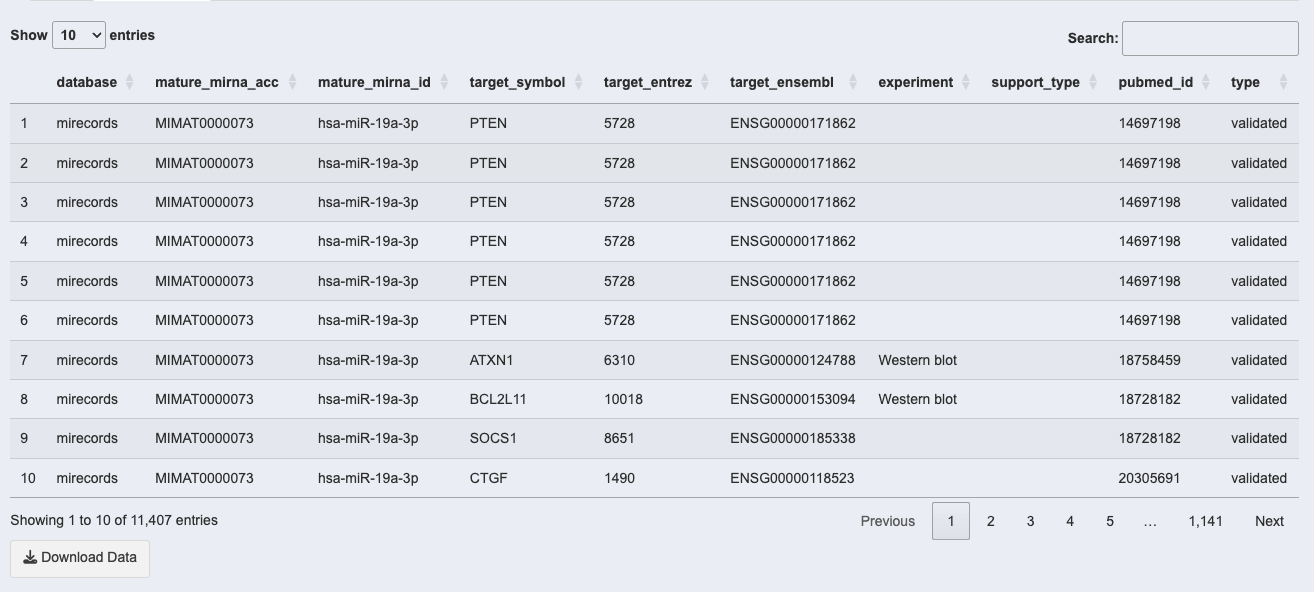
The results table provides detailed information about the identified miRNA-target interactions, with the following columns:
- database: The source database of the miRNA-target interaction (e.g., miRecords).
- mature_mirna_acc: Accession number of the mature miRNA.
- mature_mirna_id: Identifier of the mature miRNA.
- target_symbol: Symbol of the target gene regulated by the miRNA.
- target_entrez: Entrez ID of the target gene.
- target_ensembl: Ensembl ID of the target gene.
- experiment: Experimental method used to validate the interaction (e.g., Western blot).
- support_type: Type of support for the interaction (e.g., validated or predicted).
- pubmed_id: PubMed ID linking to the publication supporting the interaction.
- type: Indicates whether the interaction is validated or predicted.
4. Search and Pagination
Use the search box above the table to filter results by miRNA or target gene. Navigate through the pages of results using the pagination controls at the bottom of the table.
5. Download Data
Click the Download Data button to export the results as a CSV file for further analysis.
Troubleshooting
- If no results are found, ensure the miRNA symbols are correctly formatted.
- Try different miRNA symbols or check if the target interactions are available in the database.
For additional support, contact the system administrator.
About
CPMOAD ID: R0001
Samples: 6 control and 7 preeclampsia
Genes: 14,722
Reference: GSE263305
Differential Expression Gene (.tsv by DESeq2): R0001_DESeq2.tsv
Differential Expression Gene (.tsv by EdgeR): R0001_edgeR.tsv
CPMOAD ID: R0002
Samples: 8 Control and 7 preeclampsia
Genes: 14,555
Reference: GSE262147
Differential Expression Gene (.tsv by DESeq2): R0002_DESeq2.tsv
Differential Expression Gene (.tsv by EdgeR): R0002_edgeR.tsv
CPMOAD ID: R0003
Samples: 61 Control and 36 preeclampsia
Genes: 15,783
Reference: GSE234729
Differential Expression Gene (.tsv by DESeq2): R0003_DESeq2.tsv
Differential Expression Gene (.tsv by EdgeR): R0003_edgeR.tsv
CPMOAD ID: R0004
Samples: 10 Control and 16 preeclampsia
Genes: 16,303
Reference: GSE203507
Differential Expression Gene (.tsv by DESeq2): R0004_DESeq2.tsv
Differential Expression Gene (.tsv by EdgeR): R0004_edgeR.tsv
CPMOAD ID: R0005
Samples: 5 Control and 5 preeclampsia
Genes: 16,820
Reference: GSE177049
Differential Expression Gene (.tsv by DESeq2): R0005_DESeq2.tsv
Differential Expression Gene (.tsv by EdgeR): R0005_edgeR.tsv
CPMOAD ID: R0006
Samples: 4 Control and 4 preeclampsia
Genes: 15,748
Reference: GSE143953
Differential Expression Gene (.tsv by DESeq2): R0006_DESeq2.tsv
Differential Expression Gene (.tsv by EdgeR): R0006_edgeR.tsv
CPMOAD ID: R0007
Samples: 22 control and 22 preeclampsia
Genes: 15,879
Reference: GSE186257
Differential Expression Gene (.tsv by DESeq2): R0007_DESeq2.tsv
Differential Expression Gene (.tsv by EdgeR): R0007_edgeR.tsv
CPMOAD ID: R0008
Samples: 16 control and 24 preeclampsia
Genes: 17,652
Reference: GSE172381
Differential Expression Gene (.tsv by DESeq2): R0008_DESeq2.tsv
Differential Expression Gene (.tsv by EdgeR): R0008_edgeR.tsv
CPMOAD ID: R0009
Samples: 21 control and 20 preeclampsia
Genes: 24,016
Reference: GSE114691
Differential Expression Gene (.tsv by DESeq2): R0009_DESeq2.tsv
Differential Expression Gene (.tsv by EdgeR): R0009_edgeR.tsv
CPMOAD ID: R0010
Samples: 12 control and 16 preeclampsia
Genes: 5,029
Reference: GSE204835
Differential Expression Gene (.tsv by DESeq2): R0010_DESeq2.tsv
Differential Expression Gene (.tsv by EdgeR): R0010_edgeR.tsv
CPMOAD ID: R0011
Samples: 6 control and 7 preeclampsia
Genes: 13,849
Reference: GSE190971
Differential Expression Gene (.tsv by DESeq2): R0011_DESeq2.tsv
Differential Expression Gene (.tsv by EdgeR): R0011_edgeR.tsv
CPMOAD ID: M0001
Type: Homo sapiens
Design: 38 control and 64 preeclampsia
Regions: 3615
Reference: PMID: 37640858
Regions annotation: M0001_Methy.tsv
CPMOAD ID: M0002
Type: Cell
Design: Control VS Oxidative stress
Regions: 1397
Reference: PMID: 38899809
Regions annotation: M0002_Methy.tsv
CPMOAD ID: M0003
Type: Cell
Design: Control VS Hypoxia
Regions: 1366
Reference: PMID: 38899809
Regions annotation: M0003_Methy.tsv
CPMOAD ID: M0004
Type: Homo sapiens
Design: 20 control and 22 preeclampsia
Regions: 10
Reference: PMID: 31091979
Regions annotation: M0004_Methy.tsv
CPMOAD ID: M0005
Type: Homo sapiens
Design: 4 control and 4 preeclampsia
Regions: 9
Reference: PMID: 32250740
Regions annotation: M0005_Methy.tsv
CPMOAD ID: NC0001
Type: miRNA
Design: 5 control and 5 preeclampsia
Genes: 122
Reference: GSE241815
Differential Expression Gene (.tsv by DESeq2): NC0001_DESeq2.tsv
Differential Expression Gene (.tsv by EdgeR): NC0001_edgeR.tsv
CPMOAD ID: NC0002
Type: miRNA
Design: 7 control and 10 preeclampsia
Genes: 661
Reference: GSE234611
Differential Expression Gene (.tsv by DESeq2): NC0002_DESeq2.tsv
Differential Expression Gene (.tsv by EdgeR): NC0002_edgeR.tsv
CPMOAD ID: NC0003
Type: miRNA
Design: 5 control and 5 preeclampsia
Genes: 661
Reference: GSE206988
Differential Expression Gene (.tsv by DESeq2): NC0003_DESeq2.tsv
Differential Expression Gene (.tsv by EdgeR): NC0003_edgeR.tsv
CPMOAD ID: NC0004
Type: miRNA
Design: 3 control and 3 preeclampsia
Genes: 2633
Reference: GSE206763
Differential Expression Gene (.tsv by limma): NC0004_limma.tsv
CPMOAD ID: NC0005
Type: miRNA
Design: 5 control and 5 preeclampsia
Genes: 701
Reference: GSE177049
Differential Expression Gene (.tsv by limma): NC0005_limma.tsv
CPMOAD ID: NC0006
Type: circRNA
Design: 4 control and 4 preeclampsia
Genes: 11,433
Reference: GSE165324
Differential Expression Gene (.tsv by limma): NC0006_circRNA_limma.tsv
CPMOAD ID: NC0007
Type: lncRNA
Design: 4 control and 4 preeclampsia
Genes: 19,740
Reference: GSE165324
Differential Expression Gene (.tsv by limma): NC0007_lncRNA_limma.tsv
CPMOAD ID: NC0008
Type: mRNA
Design: 4 control and 4 preeclampsia
Genes: 18,827
Reference: GSE165324
Differential Expression Gene (.tsv by limma): NC0008_mRNA_limma.tsv
CPMOAD ID: NC0009
Type: circRNA
Design: 3 control and 3 preeclampsia
Genes: 11,433
Reference: GSE102897
Differential Expression Gene (.tsv by limma): NC0009_circRNA_limma.tsv
CPMOAD ID: NC0010
Type: lncRNA
Design: 3 control and 3 preeclampsia
Genes: 19,740
Reference: GSE102897
Differential Expression Gene (.tsv by limma): NC0010_lncRNA_limma.tsv
CPMOAD ID: NC0011
Type: mRNA
Design: 3 control and 3 preeclampsia
Genes: 18,827
Reference: GSE102897
Differential Expression Gene (.tsv by limma): NC0011_mRNA_limma.tsv
CPMOAD ID: NC0012
Type: circRNA
Design: 4 control and 3 preeclampsia
Genes: 11,433
Reference: GSE96984
Differential Expression Gene (.tsv by limma): NC0012_circRNA_limma.tsv
CPMOAD ID: NC0013
Type: lncRNA
Design: 4 control and 3 preeclampsia
Genes: 19,740
Reference: GSE96984
Differential Expression Gene (.tsv by limma): NC0013_lncRNA_limma.tsv
CPMOAD ID: NC0014
Type: mRNA
Design: 4 control and 3 preeclampsia
Genes: 18,827
Reference: GSE96984
Differential Expression Gene (.tsv by limma): NC0014_mRNA_limma.tsv
CPMOAD ID: NC0015
Type: miRNA
Design: 6 control and 7 preeclampsia
Genes: 505
Reference: GSE190972
Differential Expression Gene (.tsv by DESeq2): NC0015_DESeq2.tsv
Differential Expression Gene (.tsv by EdgeR): NC0015_edgeR.tsv
CPMOAD ID: NC0016
Type: miRNA
Design: 5 control and 5 preeclampsia
Genes: 397
Reference: GSE119799
Differential Expression Gene (.tsv by DESeq2): NC0016_DESeq2.tsv
Differential Expression Gene (.tsv by EdgeR): NC0016_edgeR.tsv
CPMOAD ID: NC0017
Type: miRNA
Design: 21 control and 20 preeclampsia
Genes: 593
Reference: GSE114349
Differential Expression Gene (.tsv by DESeq2): NC0017_DESeq2.tsv
Differential Expression Gene (.tsv by EdgeR): NC0017_edgeR.tsv
CPMOAD ID: NC0018
Type: miRNA
Design: 4 control and 4 preeclampsia
Genes: 438
Reference: GSE85926
Differential Expression Gene (.tsv by DESeq2): NC0018_DESeq2.tsv
Differential Expression Gene (.tsv by EdgeR): NC0018_edgeR.tsv
Release News
Version 1.2 (March 16th, 2026)
- Added 5 new RNA-seq datasets (R0007–R0011):
- GSE186257 — 22 control vs 22 preeclampsia, placenta
- GSE172381 — 16 control vs 24 preeclampsia, endometrium
- GSE114691 — 21 control vs 20 preeclampsia, placenta
- GSE204835 — 12 control vs 16 preeclampsia, placenta (FFPE)
- GSE190971 — 6 control vs 7 preeclampsia, placenta
- Added 4 new miRNA datasets (NC0015–NC0018):
- GSE190972 — 6 control vs 7 preeclampsia, placenta miRNA
- GSE119799 — 5 control vs 5 preeclampsia, plasma miRNA
- GSE114349 — 21 control vs 20 preeclampsia, placenta miRNA
- GSE85926 — 4 control vs 4 preeclampsia, trophoblast debris miRNA
- All new datasets processed with DESeq2 and edgeR pipelines
- Database now contains 11 RNA-seq, 5 methylation, and 18 ncRNA datasets
Version 1.1 (June 11rd, 2025)
- Optimize input gene case-sensitive issues
- Add historical version update record page
- Fix data header display problem in browsers
Version 1.0 (July 3rd, 2024)
- Initial release of CPMOAD database
- Integrated RNA-seq data from 6 different studies
- Integrated methylation data from 5 different studies
- Integrated ncRNA data from 14 different studies
- Implemented comprehensive analysis tools including:
- Differential expression analysis
- Heatmap and volcano plot visualization
- Venn diagram analysis
- KEGG and GO enrichment analysis
- GSEA analysis
- Methylation analysis
- miRNA target search